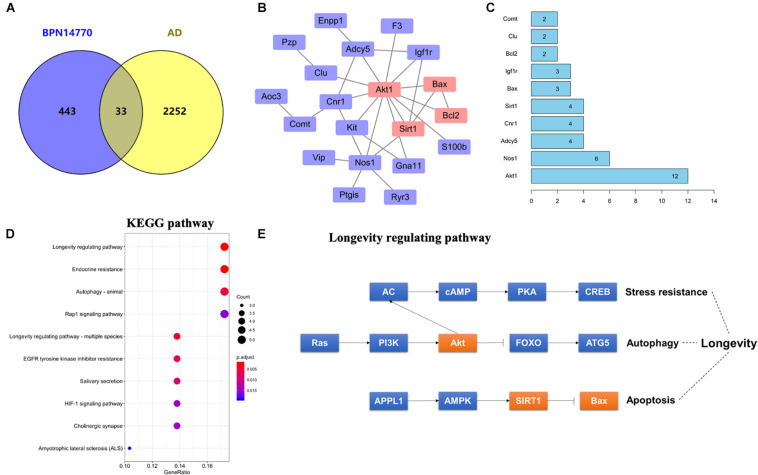
FIGURE 3.
Bioinformatic analysis of differentially expressed proteins and AD-related genes. (A) Venn diagram of differentially expressed proteins and AD-related genes. (B) The protein–protein interaction (PPI) network of the intersection genes. The red coloring highlights nodal genes that were selected for further analysis by immunoblot. (C) Bar plot of the number of hub gene links for each of the nodes in the PPI network. (D) KEGG enrichment analysis of intersection genes from the Venn diagram analysis. (E) Genes with the KEGG longevity regulating pathway and their potential interaction. Arrows represent an activating effect, T-arrows represent an inhibitory effect. The red nodes are the intersection genes that are regulated by BPN14770 and altered by AD.

