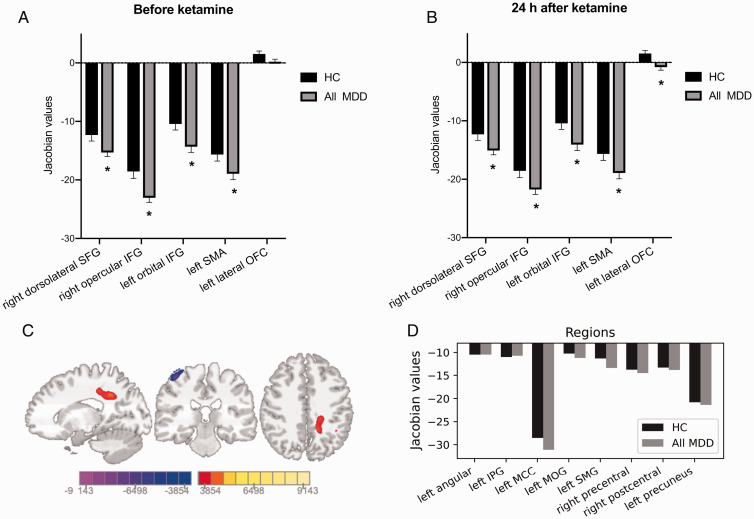
Figure 1.
Smaller volumes in the All MDD group compared to the HC group. A and B, After one single infusion of ketamine, All MDD group (including MDD and MDD/PTSD subjects) still showed smaller volume in some regions compared to HC. Additionally, left lateral OFC volume was significantly smaller in the All MDD group 24 h after ketamine administration. Bar represented mean ± SEM. Asterisks indicates significance at p < 0.05. C and D, Colored voxels showing the local volume changes in the All MDD group after ketamine administration (threshold at p < 0.001, FWE corrected). The color bar represents the t-score of Jacobian values. MNI coordinates: x= −14, y = −27, z = 41.Voxels were involved in eight regions, none of which showed significant volume difference compared to HC. IPG: inferior parietal gyrus; MCC: middle cingulate & paracingulate gyri; MOG: middle occipital gyrus; SMG: supramarginal gyrus.

