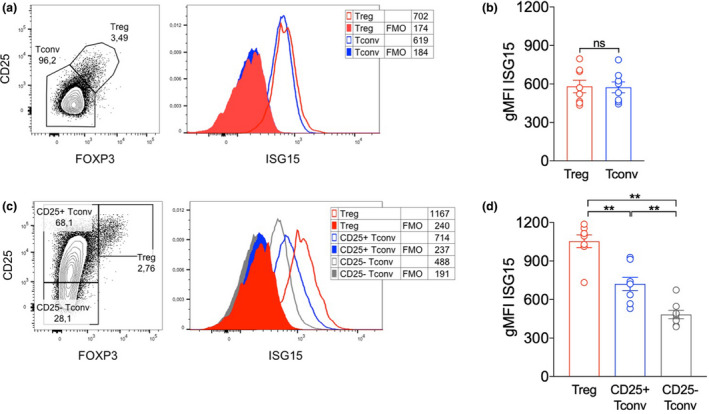
Figure 2.

ISG15 is expressed at high levels in Tregs from HDs. (a, b) Peripheral blood mononuclear cells (PBMCs) were isolated from HDs, and intracellular ISG15 content was analysed ex vivo through intracellular flow cytometry in gated Tregs (FOXP3+ CD25+) and conventional T cells (Tconvs, FOXP3− CD25−). Representative plots (a) and means ± SEM of ISG15 expression (b) are depicted. (c, d) ISG15 expression was analysed after a 48‐h culture with anti‐CD3, in gated Tregs (FOXP3hi CD25hi), activated Tconvs (FOXP3− CD25+) and resting Tconvs (FOXP3− CD25−). Representative plots (c) and means ± SEM of ISG15 expression (d) are depicted. In all panels, numbers indicate the geometric mean fluorescence intensity (gMFI). FMO, fluorescence‐minus‐one control. Data shown are from eight HDs, analysed in two independent experiments. **P < 0.01, by the Wilcoxon matched‐pairs test; ns, not significant.
