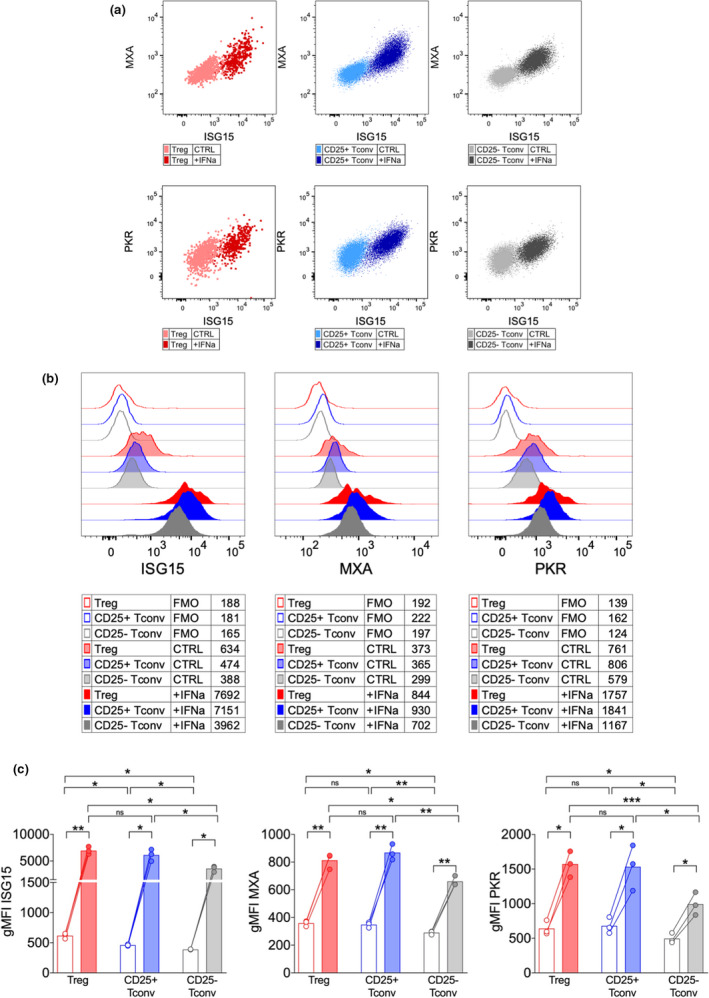
Figure 4.

Only ISG15, but not MXA and PKR, are more expressed by activated Tregs compared to Tconvs. Peripheral blood mononuclear cells (PBMCs) were isolated from HDs (n = 3) and cultured 48 h with anti‐CD3 alone (CTRL) or plus recombinant human IFNα (104 IU mL−1); then, the expression of ISG15, MXA and PKR was analysed by intracellular flow cytometry. (a) Representative overlays in the indicated subsets/conditions, showing coexpression of ISG15 and MXA or PKR. (b) Representative histograms and (c) means ± SEM of ISG15, MXA or PKR expression (estimated as geometric mean fluorescence intensity, gMFI) are shown in the indicated subsets and conditions. FMO, fluorescence‐minus‐one control. *P < 0.05, **P < 0.01, ***P < 0.005, by the paired t‐test; ns, not significant.
