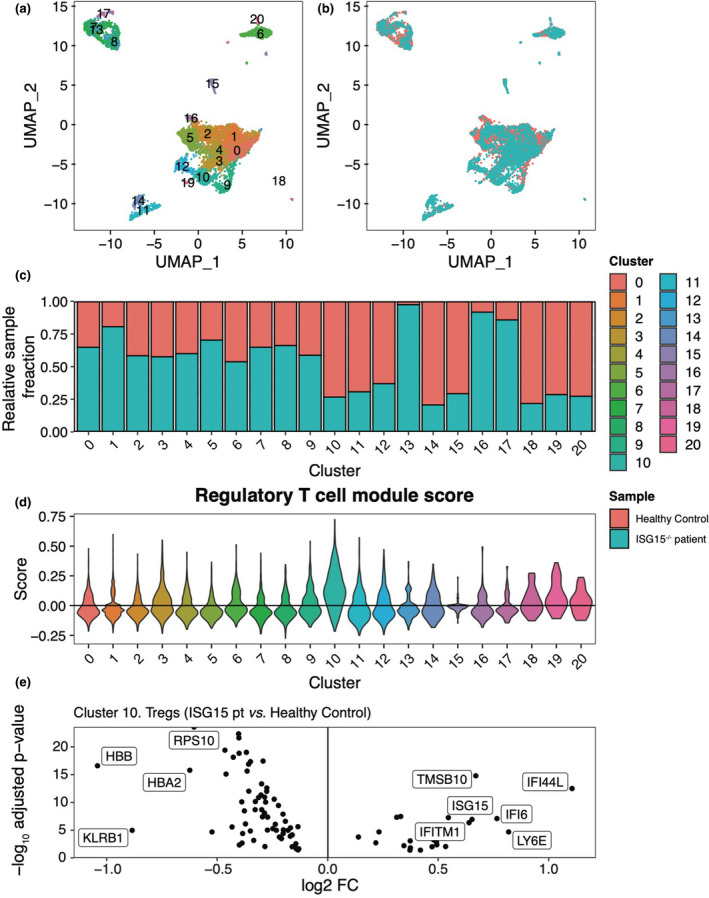
Figure 6.

Single‐cell RNA‐sequencing analysis of ISG15−/− peripheral blood mononuclear cells (PBMCs) hints at an ISG signature in regulatory T cells. (a) UMAP visualisation of patient and control PBMCs (n = 7590 cells). Points (cells) are coloured by cluster assignment. (b) Corresponding UMAP visualisation coloured by sample identity (Healthy control, ISG15−/− patient). (c) Relative sample fractions of all clusters. (d) Regulatory T‐cell marker gene module scores across all clusters. Gene set includes CD4, IL2RA (CD25), FOXP3, CD5, ENTPD1, ITGAE, LAG3, CTLA4, TNFRSF4 (OX40) and TNFRSF18 (GITR). Scores represent the average expression level of the gene set subtracted by the aggregated expression of a random control feature set (n = 5 genes). (e) Volcano plot showing fold changes for genes differentially expressed between regulatory T cells (cluster 10) from the ISG15−/− patient and regulatory T cells from the healthy control. Genes with a fold change greater than ± 1.5 and an adjusted P‐value < 0.05 are labelled.
