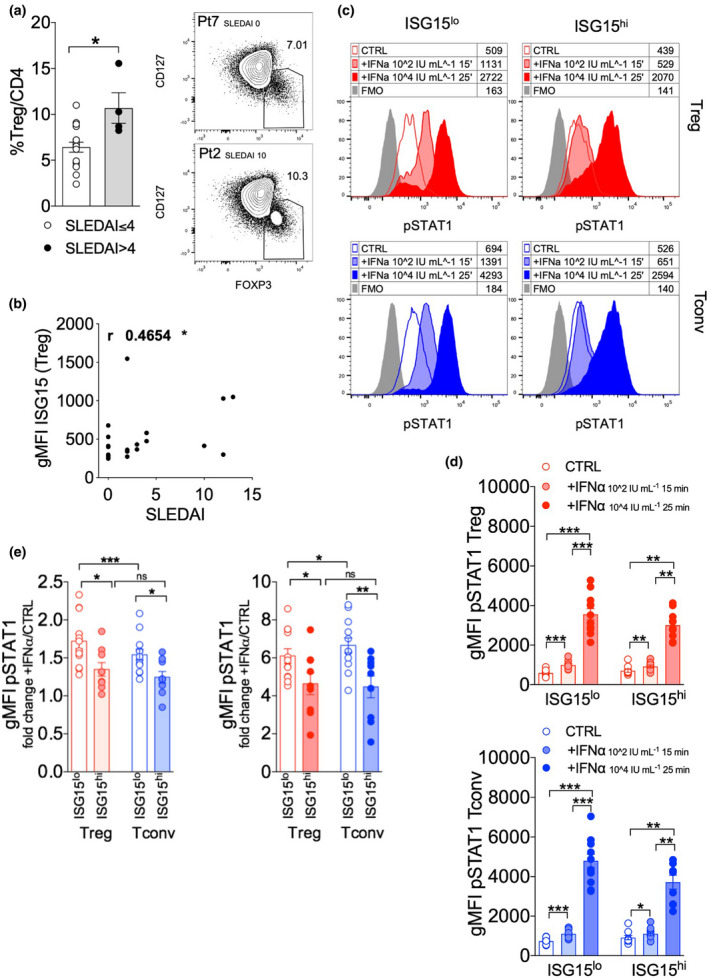
Figure 7.

ISG15 hinders STAT1 phosphorylation of Tregs from systemic lupus erythematosus (SLE) patients exposed to IFN ex vivo. (a) Treg frequency (as FOXP3+ CD127lo cells) and ISG15 expression in Tregs were estimated through flow cytometry in peripheral blood mononuclear cells (PBMCs) obtained from SLE patients (n = 21), stratified according to their SLEDAI score into ≤ 4 (n = 17) or > 4 (n = 4). Dot plots from two representative patients, Pt7 and Pt2, are shown. *P < 0.05, by the Mann–Whitney U‐test. (b) Spearman correlation between the SLEDAI score and the gMFI of ISG15 in Tregs in all patients. *P < 0.05. (c–e) SLE patients were stratified into ISG15lo (n = 12) and ISG15hi (n = 9), and intracellular staining for pSTAT1 was performed in gated Tregs and Tconvs from PBMCs, either freshly isolated (CTRL) or pulsed ex vivo with recombinant human IFNα (102 IU mL−1 for 15 min or 104 IU mL−1 for 25 min). (c) Representative histograms overlay and (d) means ± SEM of pSTAT1 levels (estimated as geometric mean fluorescence intensity, gMFI) are shown in the indicated subsets and conditions. (e) Fold change in pSTAT1 levels was calculated as the ratio between IFN stimulation at 102 IU mL−1 for 15 min and CTRL (left plot), or between IFN stimulation at 104 IU mL−1 for 25 min and CTRL (right plot). *P < 0.05, **P < 0.01, ***P < 0.005, by the Mann–Whitney U‐test between ISG15lo and ISG15hi patients, and by the Wilcoxon matched‐pairs test between Tregs and Tconvs or between CTRL and +IFNα; ns, not significant.
