Fig. 3.
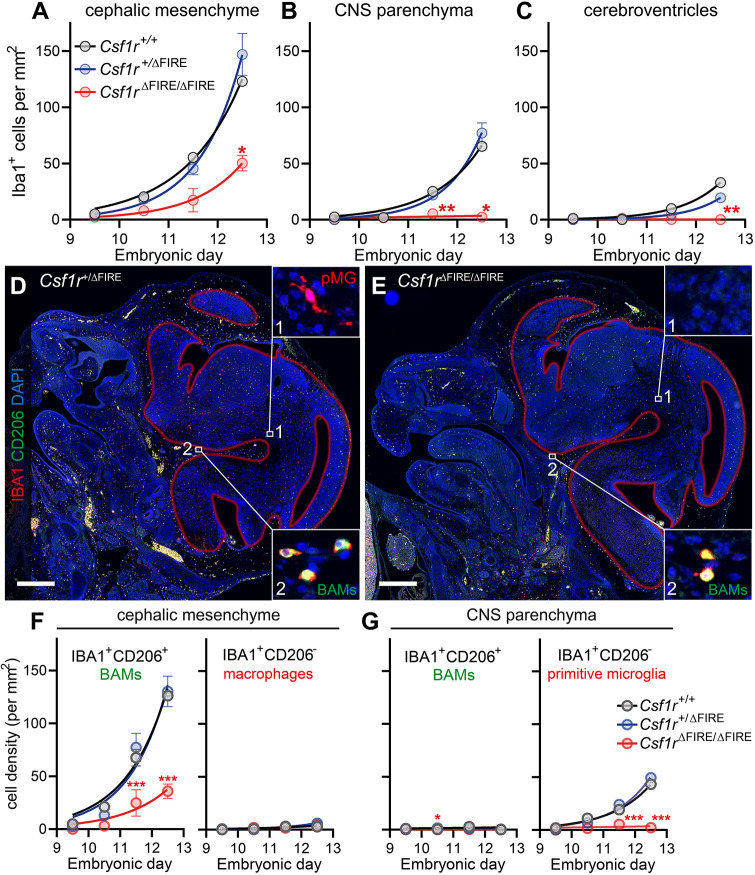
FIRE deletion differentially impairs microglial and BAM arrival dynamics. (A-C) Macrophage arrival dynamics in the (A) cephalic mesenchyme, (B) CNS parenchyma and (C) cerebroventricles of Csf1r+/+, Csf1r+/ΔFIRE and Csf1rΔFIRE/ΔFIRE embryos. Number of embryos per genotype (embryos per embryonic day): Csf1r+/+, 8 (1-4); Csf1r+/ΔFIRE, 16 (3-5); Csf1rΔFIRE/ΔFIRE, 17 (3-5). (D,E) Representative images of E12.5 embryonic heads from (D) Csf1r+/ΔFIRE and (E) Csf1rΔFIRE/ΔFIRE mice stained with anti-IBA1 (red), anti-CD206 (green) and DAPI (blue). Auto-fluorescent erythrocytes are also yellow. Red lines depict the borders of the developing CNS tissue. Insets show (1) IBA1+CD206− primitive microglia (pMG) and (2) IBA1+CD206+ BAMs. (F,G) Quantification of IBA1+CD206+ BAMs and IBA1+CD206− primitive microglia in (F) cephalic mesenchyme and (G) CNS parenchyma of Csf1r+/+, Csf1r+/ΔFIRE and Csf1rΔFIRE/ΔFIRE embryos. Number of embryos per genotype (embryos per embryonic day): Csf1r+/+, 10 (1-5); Csf1r+/ΔFIRE, 16 (3-4); Csf1rΔFIRE/ΔFIRE, 17 (3-5). Mixed-effects analysis with Tukey-corrected multiple comparison post-tests were performed for A-C and F,G. Statistically significant differences compared with the Csf1r+/ΔFIRE group are shown (*P<0.05, **P<0.01, ***P<0.001). Data are mean±s.e.m. Scale bars: 500 µm.

