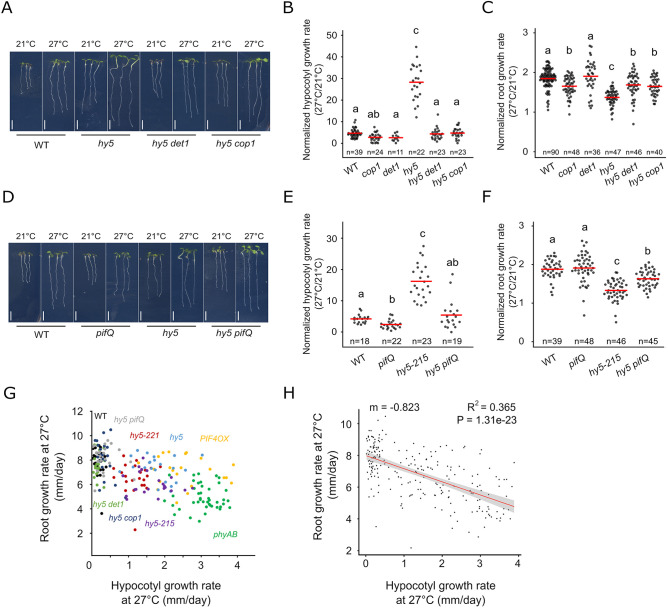
Fig. 3.
The HY5-PIF module regulates the root response to temperature. (A) Wild-type (WT), hy5, hy5 det1 and hy5 cop1 mutant seedlings at 6 DAG and 3 days after transfer to 21°C or 27°C. (B,C) Normalized hypocotyl (B) and root growth (C) (27°C/21°C) in WT, cop1, det1, hy5, hy5 det1 and hy5 cop1 seedlings. (D) WT, pifQ, hy5 and hy5 pifQ mutant seedlings at 6 DAG and 3 days after transfer to 21°C or 27°C. (E,F) Normalized hypocotyl (E) and root growth (F) (27°C/21°C) in WT, pifQ, hy5-215 and hy5 pifQ seedlings. (G,H) Relation between root and hypocotyl growth rate at 27°C, as shown with measurements on individual WT (n=23), hy5-221 (n=24), phyAB (n=43), PIF4OX (n=22), hy5 (n=22), hy5 det1 (n=20), hy5 cop1 (n=22), hy5-215 (n=23) and hy5 pifQ (n=22) plants (G) and after non-parametric regression analysis (H). Shaded region in H indicates a point-wise 95% confidence interval on the fitted values (red line). n indicates the number of individual seedlings measured. Measured seedlings were obtained in one (G,H) or three (B,C,E,F) independent replications of the experiment. In B,C,E,F, groups denoted by different letters are significantly different from one another (P<0.05; one-way ANOVA and Tukey HSD post hoc test in C,F; one-way ANOVA after log10 transformation in B,E). Linear regression method, Pearson correlation (H). Red bar represents the mean (B,C,E,F). Scale bars: 5 mm.

