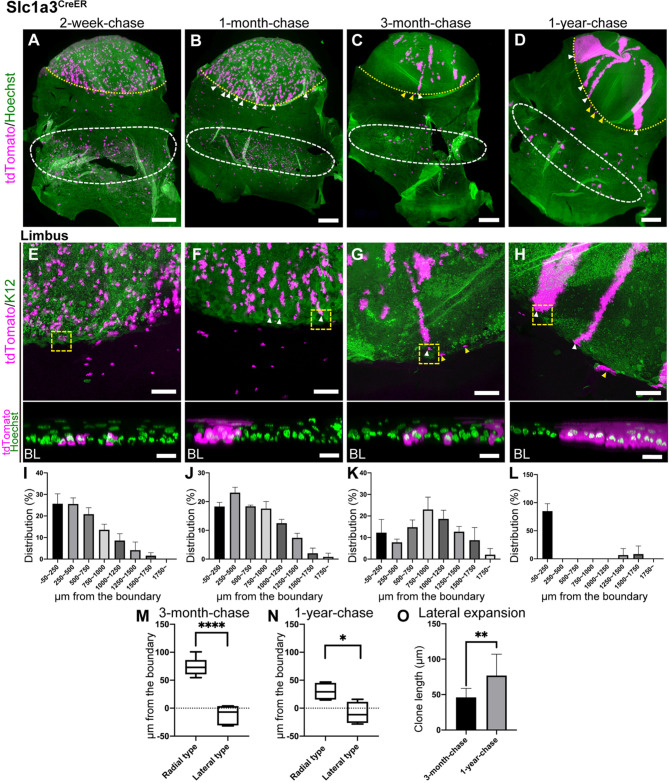
Fig. 2.
Lineage tracing of Slc1a3CreER in the limbus and cornea. (A-H) Whole-mount immunostaining at 2-week-, 1-month-, 3-month- and 1-year-chases. The yellow dotted line represents the corneal/conjunctival boundary and the white dashed line represents tdTomato+ cell-enriched area in the fornix conjunctiva (A-D). Limbal areas are shown as a maximum-intensity projection (E-H, top). The representative limbal clones, surrounded by the yellow dashed square, are shown as a side view of z-stack confocal images (E-H, bottom; BL, basal layer). White arrowheads indicate tdTomato+ radial stripes extended from the limbus (B-D,F-H). Yellow arrowheads indicate tdTomato+ clones expanded laterally within the limbal region (C,D,G,H). Magenta, tdTomato. Green, Hoechst (A-D,E-H, bottom), K12 (E-H, top, corneal marker). (I-L) Distribution of the length of tdTomato+ clones from the corneal/conjunctival boundary at 2-week-, 1-month-, 3-month- and 1-year-chases expressed as the percentage of total clones. The boundary is defined by the K12 marker. n=3 mice. All tdTomato+ clones in whole-mount samples from a half eye were measured and used for quantification. Data are mean±s.d. (M,N) The positions of radial and lateral clones are measured from the boundary at 3-month-chase (M) and 1-year-chase (N). The boundary is defined by the K12 marker. n=3 mice. (O) Length of laterally expanding clones at 3-month-chase and 1-year-chase. n=3 mice. Data are mean±s.d. Box plots show median values (middle bars) and first to third interquartile ranges (boxes); whiskers indicate 1.5× the interquartile ranges. *P<0.05, **P<0.01, ****P<0.001 (Student's t-test). Scale bars: 500 μm (A-D); 200 μm (E-H, top); 20 μm (E-H, bottom).

