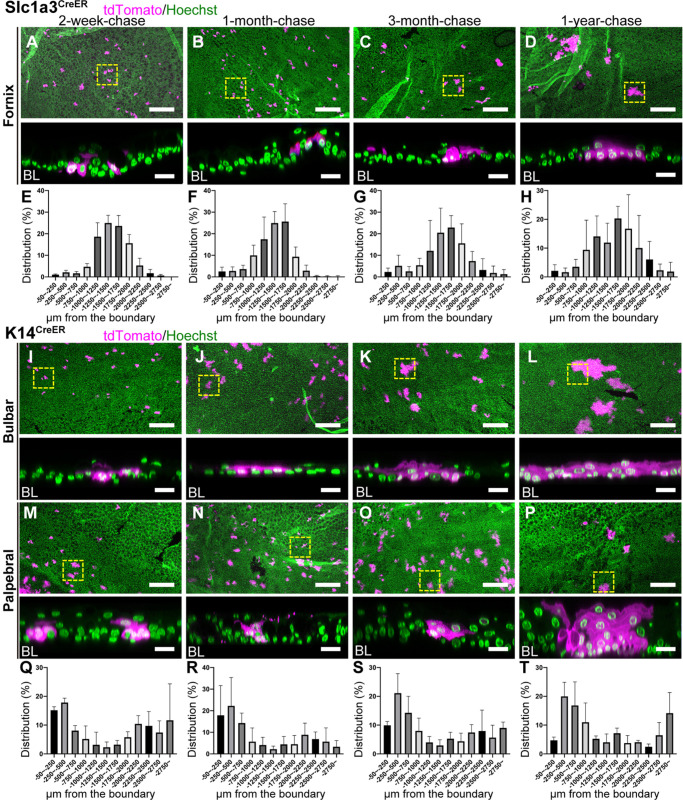
Fig. 4.
Lineage tracing of Slc1a3CreER and K14CreER in the conjunctiva. (A-D) Lineage tracing of Slc1a3CreER in the conjunctiva at 2-week-, 1-month-, 3-month- and 1-year-chases. Fornix conjunctival areas are shown as a maximum-intensity projection (A-D, top). The representative fornix conjunctival clones, surrounded by the yellow dashed square, are shown as a side view of z-stack confocal images (A-D, bottom; BL, basal layer). (E-H) Distribution pattern of tdTomato+ clones. Length from the corneal/conjunctival boundary to the center of each clone was measured. The boundary is defined by the K12 marker. n=3 mice. All tdTomato+ clones in whole-mount samples from a half eye were measured and used for quantification. Data are mean±s.d. (I-P) Lineage tracing of K14CreER in the conjunctiva at 2-week-, 1-month-, 3-month- and 1-year-chases. Bulbar (I-L) and palpebral (M-P) conjunctival areas are shown as a maximum-intensity projection (I-P, top). The representative bulbar and palpebral conjunctival clones, surrounded by the yellow dashed square, are shown as a side view of z-stack confocal images (I-P, bottom; BL, basal layer). Magenta, tdTomato. Green, Hoechst. (Q-T) Distribution pattern of tdTomato+ clones. Length from the corneal/conjunctival boundary to the center of each clone was measured. The boundary is defined by the K12 marker. n=3 mice. All tdTomato+ clones in whole-mount samples from a half eye were measured and used for quantification. Data are mean±s.d. Scale bars: 200 μm (A-D,I-P, top); 20 μm (A-D,I-P, bottom).

