Fig. 2.
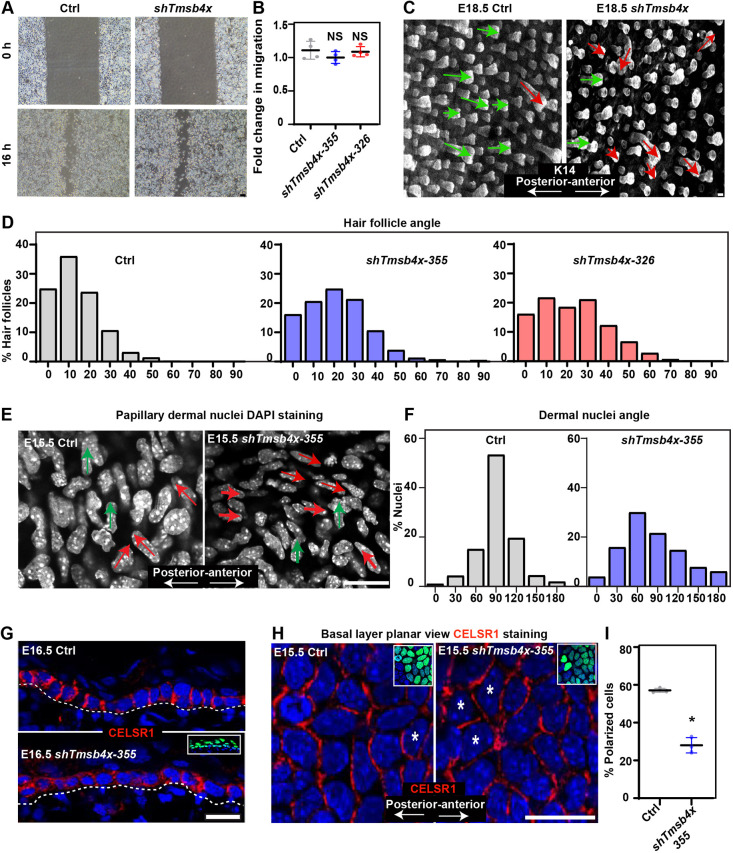
Tmsb4x depletion hinders planar cell polarity. (A) Phase contrast microscopy images of shScr- (Ctrl) and shTmsb4x-355-transduced primary mouse keratinocytes in a wound-healing migration assay. Cells were incubated in medium containing 50 µM calcium. (B) Quantification of cell migration from the data shown in A. Horizontal bars represent mean±s.d. from four experiments and circles represent single experiment. NS, not significant (P=0.7079 and P=0.1719 for Ctrl versus shTmsb4x-355 and shTmsb4x-326, respectively) by unpaired two-tailed t-test. (C) Whole-mount immunofluorescence images of control (Ctrl) and shTmsb4x-355-transduced E18.5 embryos immunostained for K14 (white). Green and red arrows were drawn manually to indicate normal (up to 30° relative to the anterior-posterior axis) and abnormal (more than 30° relative to the anterior-posterior axis) hair follicle angles, respectively. (D) Quantification of hair-follicle angle relative to the anterior-posterior axis from the data shown in C. n=442 Ctrl, 869 shTmsb4x-355 and 465 shTmsb4x-326 hair follicles, from three embryos per condition. (E) Whole-mount immunofluorescence images of the dorsal skin papillary dermis from control (Ctrl) and shTmsb4x-355-transduced E15.5 embryos. Nuclei are labelled with DAPI (white). Green and red arrows were drawn manually to indicate perpendicular and non-perpendicular dermal nuclei orientation, respectively, relative to the anterior-posterior axis. (F) Quantification of nuclei orientation from the data shown in H. n=667 and 510 cells from three Ctrl and shTmsb4x-355-transduced embryos per condition, respectively. (G) Sagittal views of 10-μm sections of dorsal skin from control (Ctrl) and shTmsb4x-355-transduced E16.5 embryos. Sections were immunostained for the core PCP protein CELSR1. Insets show the transduced cells (H2B-GFP+). Dashed lines indicate the dermal-epidermal border. (H) Whole-mount immunofluorescence images of dorsal skin from control (Ctrl) and shTmsb4x-355-transduced E15.5 embryos immunostained for CELSR1 (red) and imaged at the middle of the basal layer. Asterisks were drawn manually to indicate representative non-polarized cells. Insets show the transduced cells (H2B-GFP+). (I) Quantification of CELSR1-polarized cells from the data shown in E. Horizontal bars represent mean±s.d. and circles represent individual embryos. n=3 embryos per condition. *P=0.0003 by unpaired two-tailed t-test. Scale bars: 50 µm (A); 20 μm (C,E,G,H).

