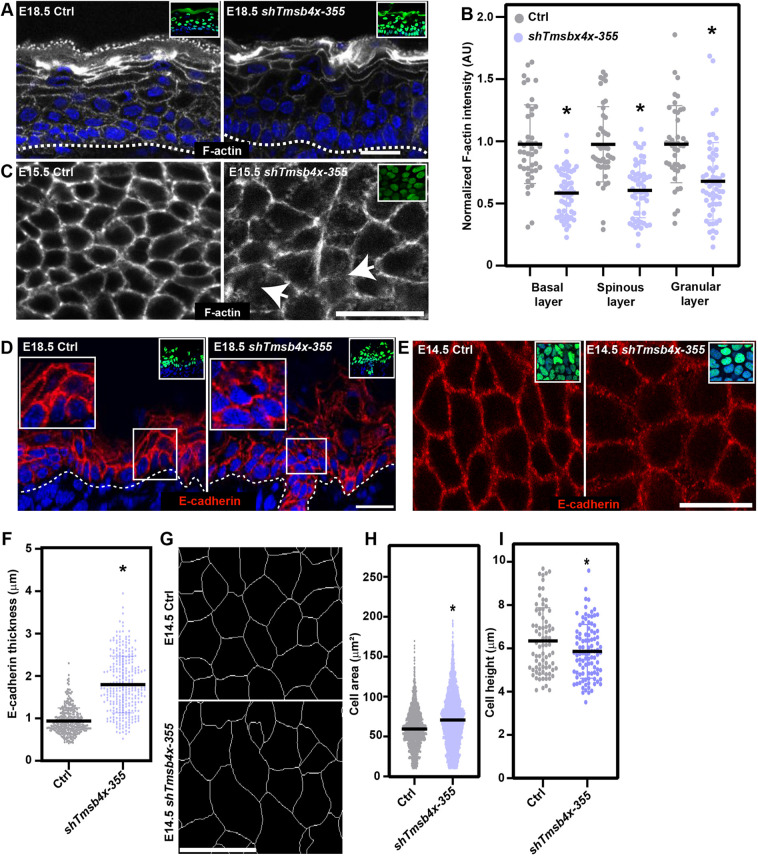
Fig. 3.
Tmsb4x depletion affects the actin cytoskeleton and adherens junctions. (A) Sagittal views of dorsal skin sections from control (Ctrl) and shTmsb4x-transduced E18.5 embryos labelled with fluorescent Phalloidin to visualize F-actin (white). (B) Quantification of F-actin staining intensity from the data shown in A. Horizontal bars represent the mean normalized Phalloidin intensity, and circles represent individual microscopy fields. n=4 embryos per condition. P=0.0025 for Ctrl versus shTmsb4x-355 basal layer; P=0.0054 for Ctrl versus shTmsb4x-355 spinous layer; P=0.0128 Ctrl versus shTmsb4x-355 granular layer by unpaired two-tailed t-test. (C) Whole-mount immunofluorescence images of control (Ctrl) and shTmsb4x-355-transduced E15.5 embryos labelled with fluorescent Phalloidin to visualize F-actin (white) and imaged at the middle of the basal layer. Arrows indicate diffuse F-actin staining. (D) Sagittal views of dorsal skin sections from control (Ctrl) and shTmsb4x-355-transduced E18.5 embryos immunolabelled for E-cadherin. Insets (right) show magnification of boxed areas. (E) Whole-mount immunofluorescence images of control (Ctrl) and shTmsb4x-355-transduced E14.5 embryos immunolabelled for E-cadherin and imaged at the middle of the basal layer. (F) Quantification of adherens junction thickness from the data shown in E. n=346 and 279 Ctrl and shTmsb4x-355-transduced cells, respectively, from three embryos per condition. Horizontal bars represent the mean, and circles represent individual cells. P<0.0001 by unpaired two-tailed t-test. (G) Whole-mount immunofluorescence images of control (Ctrl) and shTmsb4x-355-transduced E14.5 embryos immunolabelled for E-cadherin (white) with computer segmentation to visualize cell borders. (H) Quantification of cell areas from the data shown in G. n=1989 and 3721 Ctrl and shTmsb4x-355-transduced cells, respectively, from three embryos per condition. Horizontal bars represent the mean, and circles represent individual cells. P<0.0001 by unpaired two-tailed t-test. (I) Quantification of basal layer cell height from the data shown in D. n=77 and 99 Ctrl and shTmsb4x-H2B-GFP-transduced cells, respectively, from three embryos per condition. Horizontal bars represent the mean, and circles represent individual cells. P=0.0026 by unpaired two-tailed t-test. Nuclei were stained with DAPI (blue). Dotted lines indicate the dermal-epidermal border, and insets show the transduced cells (H2B-GFP+). Scale bars: 20 μm. *P<0.05.

