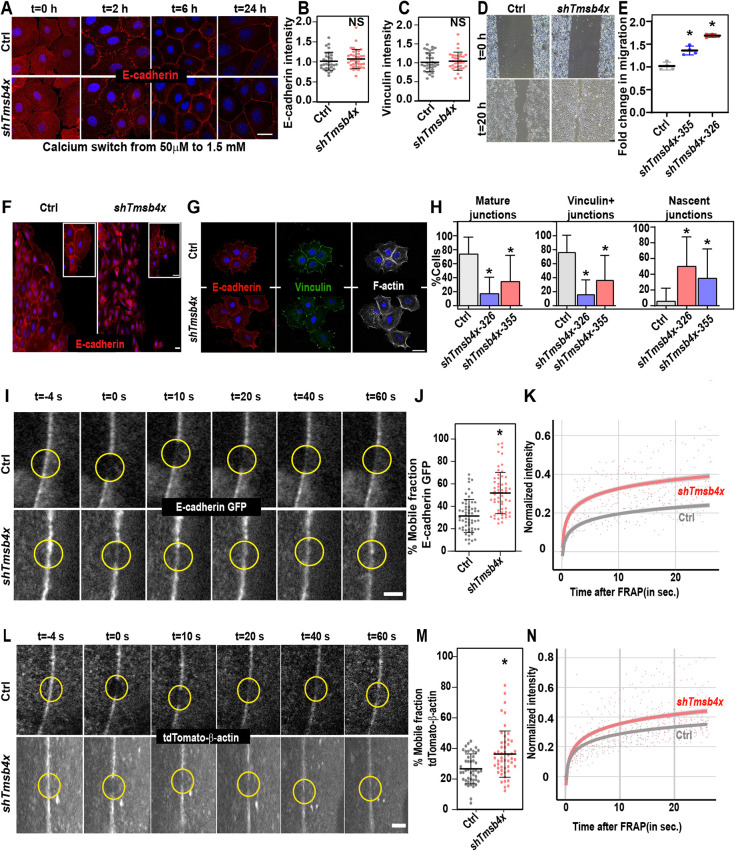
Fig. 4.
Tmsb4x depletion hinders adherens junction stability. (A) shScr- (Ctrl) and shTmsb4x-326-transduced primary mouse keratinocytes (PMKs) were induced to form adherens junctions by switching from low-calcium (50 μM) to high-calcium (1.5 mM) media and then immunolabelled for E-cadherin at the indicated time points. (B,C) Quantification of E-cadherin (B) and vinculin (C) junctional intensity in shScr- (Ctrl) and shTmsb4x-transduced PMKs at 24 h after switching from low-calcium (50 μM) to high-calcium (1.5 mM) media. Horizontal bars represent mean±s.d. intensity, circles represent intensity from single microscopic fields. NS, not significant by unpaired two-tailed t-test. (D) Phase contrast microscopy images of shScr- (Ctrl) and shTmsb4x-355-transduced PMKs in a wound-healing migration assay. Cells were incubated in medium containing 0.3 mM calcium. (E) Quantification of cell migration from the data shown in D Horizontal bars represent mean±s.d. from four experiments and circles represent a single experiment. P=0.01 for Ctrl versus shTmsb4x-355- and P=0.0004 for Ctrl versus shTmsb4x-326-transduced cells, by unpaired two-tailed t-test. (F) Leading-edge PMKs from the wound-healing migration assay (D) were immunostained for E-cadherin. (G) Small colonies (4-8 cells) of shScr- (Ctrl) and shTmsb4x-326-transduced PMKs were labelled for E-cadherin, vinculin and F-actin. (H) Quantification of adherens junction organization from the data shown in G. Mean±s.d. of Ctrl, n=40 colonies; shTmsb4x-355, n=35 colonies; and shTmsb4x-326, n=35 colonies from three independent experiments. For nascent junctions, P<0.0001 for Ctrl versus shTmsb4x-326 and P=0.0014 for Ctrl versus shTmsb4x-355. For mature junctions: P<0.0001 for Ctrl versus shTmsb4x-326 and P=0.0003 for Ctrl versus shTmsb4x-355. For vinculin-positive junctions: P<0.0001 for Ctrl versus shTmsb4x-326 and P=0.0003 for Ctrl versus shTmsb4x-355. All analyses were by unpaired two-tailed t-test. (I) Representative images of FRAP of E-cadherin-GFP in shScr- (Ctrl) and shTmsb4x-326-transduced PMKs. Yellow circles denote bleached regions. (J) Mobile fraction chart from the FRAP experiments shown in I. Ctrl, n=54 cells and shTmsb4x-326, n=55 cells from four independent experiments. Horizontal bar represents the mean±s.d., dots represent individual cells. P<0.0001 by unpaired two-tailed t-test. (K) Representative FRAP recovery curves from the data shown in I. (L) Representative images of FRAP of junctional tdTomato-β-actin in shScr- (Ctrl) and shTmsb4x-326-transduced PMKs. Yellow circles denote bleached regions. (M) Mobile fraction charts from the data shown in L. Ctrl, n=39 cells and shTmsb4x-326, n=52 cells from four independent experiments. P=0.0003 by unpaired two-tailed t-test. (N) Representative FRAP recovery curves from the data shown in L. Scale bars: 20 µm (A,F,G); 50 µm (D); 5 µm (I,L). *P<0.05.

