Fig. 5.
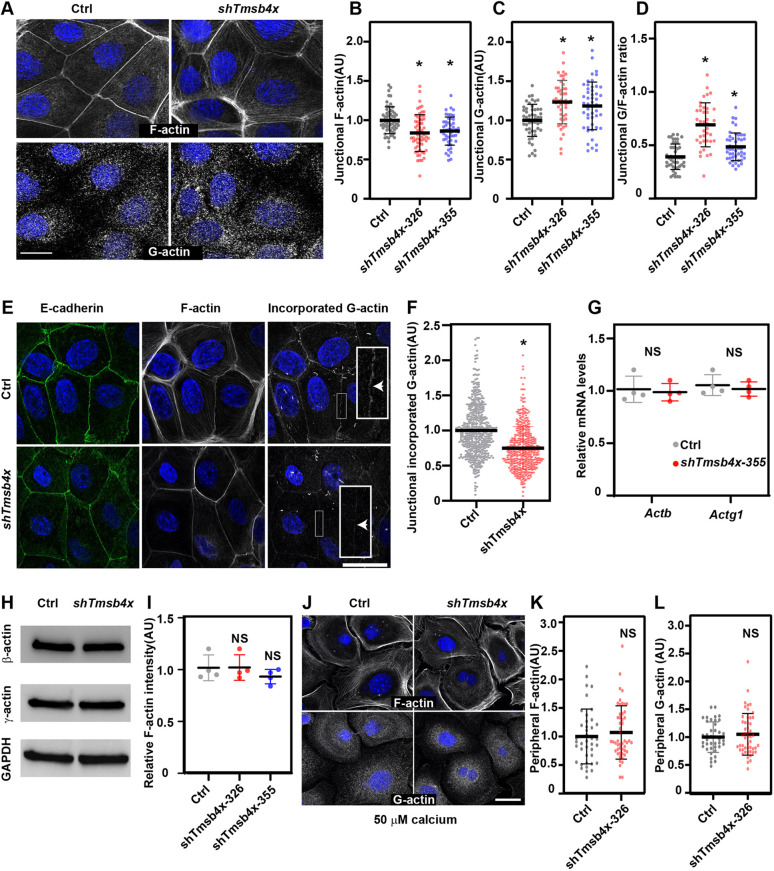
Tmsb4x depletion alters the junctional G/F-actin ratio in keratinocytes. (A) shScr- (Ctrl) and shTmsb4x-transduced primary mouse keratinocytes (PMKs) were labelled for F-actin and G-actin 24 h after switching from 50 μM to 1.5 mM calcium-containing media. (B,C) Quantification of junctional F-actin (B) and G-actin (C) intensity from the data shown in A. Data are the mean±s.d. from Ctrl, n=59 microscopic fields; shTmsb4x-355, n=59 microscopic fields; and shTmsb4x-326, n=49 microscopic fields from four independent experiments. P<0.0001 for Ctrl versus Tmsb4x-326 and versus Tmsb4x-355 by unpaired two-tailed t-test. (D) Quantification of the G/F-actin ratio from the data shown in A-C. Data are the mean±s.d. P<0.0001 for Ctrl versus Tmsb4x-326 and P=0.0064 for Ctrl versus Tmsb4x-355, by unpaired two-tailed t-test. (E) shScr- (Ctrl) and shTmsb4x-transduced PMKs were lightly permeabilized in the presence of rhodamine-actin, fixed and labelled for E-cadherin and F-actin. (F) Quantification of junctional incorporated rhodamine-actin from the data shown in E. Data are the mean±s.d. from Ctrl, n=490 junctions; shTmsb4x-326, n=452 junctions from three independent experiments. P<0.0001 by unpaired two-tailed t-test. (G) qPCR analysis of relative Actb and Actg1 mRNA levels in shScr- (Ctrl) or shTmsb4x-326-trabnsduced PMKs. Horizontal bar represents mean±s.d. of four independent experiments and circles represent single experiments. NS, not significant. (H) Western blot analysis of Ctrl or shTmsb4x-326-transduced PMKs. Blots were probed with antibodies to β-actin, γ-actin or GAPDH (loading control). (I) Flow cytometry analysis of F-actin (Phalloidin) relative intensity in control, Tmsb4x-326 and Tmsb4x-355-depleted PMKs. Horizontal bar represents mean±s.d. of three independent experiments and circles represent single experiments. NS, not significant. (J) Ctrl and shTmsb4x-326-transduced PMKs were incubated in low-calcium (50 μM) medium and labelled for F-actin and G-actin. (K,L) Quantification of peripheral F-actin (H) and G-actin (I) intensity from the data shown in G. Data are the mean±s.d. of Ctrl, n=68 cells and shTmsb4x-326, n=81 cells from three independent experiments. NS, not significant (P=0.331 and P=0.630 for F-actin and G-actin, respectively) by unpaired two-tailed t-test. Scale bars: 20µm. *P<0.05.

