Fig. 6.
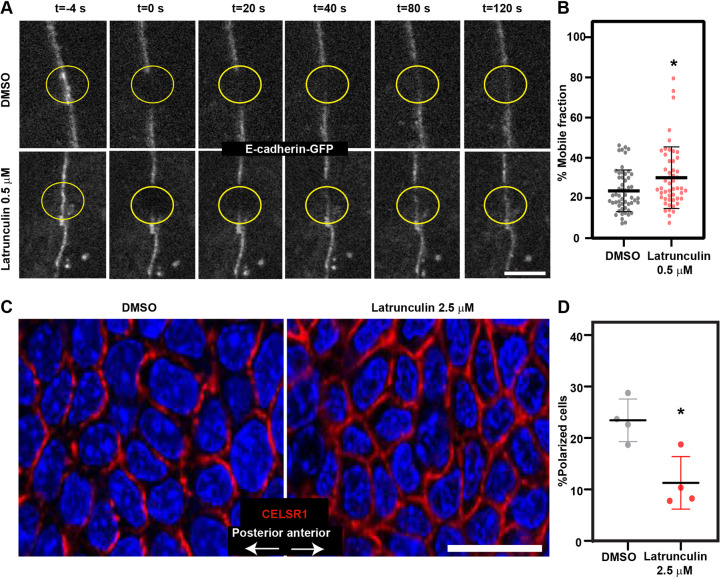
Latrunculin treatment mimics TMSB4X loss-of-function phenotype. (A) Representative images of FRAP of E-cadherin-GFP in PMKs treated for 30 min with DMSO (control) or 0.5 µM latrunculin. Yellow circles denote bleached regions. (B) Percentage mobile fraction from the data shown in A. DMSO, n=53 cells and 0.5 µM latrunculin, n=55 cells. P=0.0124 by unpaired two-tailed t-test. Data are mean±s.d. from three independent experiments. (C) Whole-mount immunofluorescence images of the dorsal skin from wild-type E15.5 embryos treated ex vivo with DMSO (control) or 2.5 µM latrunculin, and then immunostained for CELSR1 (red) and imaged at the middle of the basal layer. (D) Quantification of polarized cells from the data shown in C. Horizontal bar represents mean±s.d. from four embryos and circles represent individual embryos. n=4 embryos per condition. P=0.01 by unpaired two-tailed t-test. Scale bars: 5 µm (A); 20 µm (C). *P<0.05.

