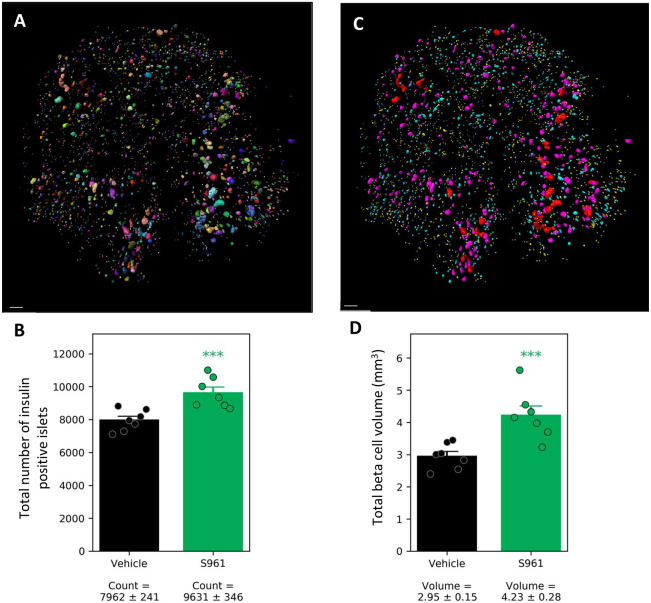
Fig. 3.
Increased beta cell volume and number of insulin-positive islets following S961 treatment. (A) Using the insulin signal, each islet was assigned a unique ID and a volume, making it possible to calculate the total number of insulin-positive islets and the total beta cell volume. (B) Total number of insulin-positive islets in vehicle- and S961-treated mice. (C) The same pancreas as shown in A, color coded for size distribution. The insulin-positive islets were allocated into four bins: small (yellow; 25-170×1000 µm3), medium (cyan; 170-1100×1000 µm3), large (magenta; 1100-7500×1000 µm3) and very large (red; 7500-50000×1000 µm3). (D) Total mean beta cell volume in the study groups. Individual data points are indicated. For statistical analysis, we used unpaired Student's t-test. ***P<0.001, S961 compared to vehicle. Error bars represent s.e.m. Scale bars: 500 µm.

