Fig. 2.
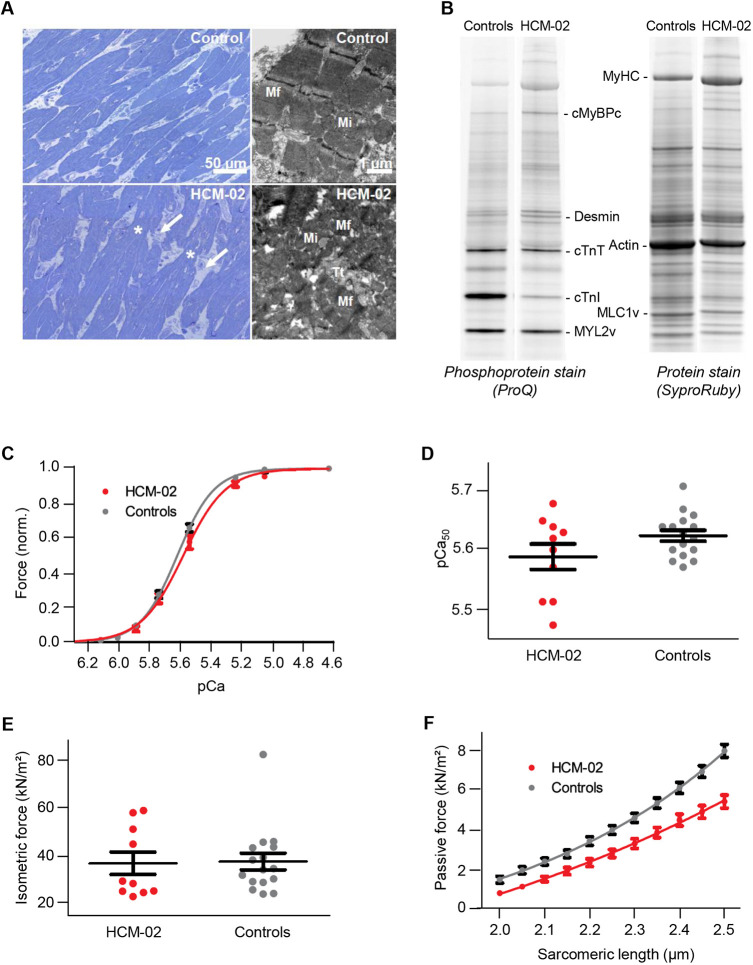
Reduced passive force in CMs derived from a HCM-patient with a MYOM2 mutation. (A) Light and electron micrographs of control (upper panel) and patient HCM-02 (lower panel) myocardial samples. In comparison to the control myocardium, the patient sample showed disoriented CMs (disarray) with great variations in cellular diameter. Irregularly formed connections between CMs (asterisks) and widened interstitial spaces (white arrows) were present. Within CMs, myofibrils (Mf) of the patient frequently showed disarray, with sarcomeres running in various directions, whereas the sarcomeres of control tissue were mostly parallel. Mi, mitochondria; Tt, T-tubule. (B) Example of gel electrophoretic analysis of the phosphorylation status of native myocardial tissue from HCM-02 and controls. For detailed analysis see Fig. S2A. (C) Isometric force generation at increasing calcium concentrations (pCa) normalized to maximum force. Lines were fitted according to a modified Hill equation (Kraft et al., 2013). (D) Calcium concentration at 50% of maximum force generation (pCa50) derived from fitted curves in C. (E) Isometric force at maximum calcium activation (pCa 4.63) appeared not to be altered in HCM-02 CMs carrying the mutation. (F) Passive force at increasing sarcomere length showed a significant reduction for HCM-02 CMs carrying a MYOM2 mutation, compared to controls (P<0.01 for all sarcomere lengths). All functional analyses of CMs from HCM-02 and the control in C-F occurred after adjustment of PKA-dependent phosphorylation (n=16 control CMs; n=10 HCM-02 CMs). Data are mean±s.e.m.

