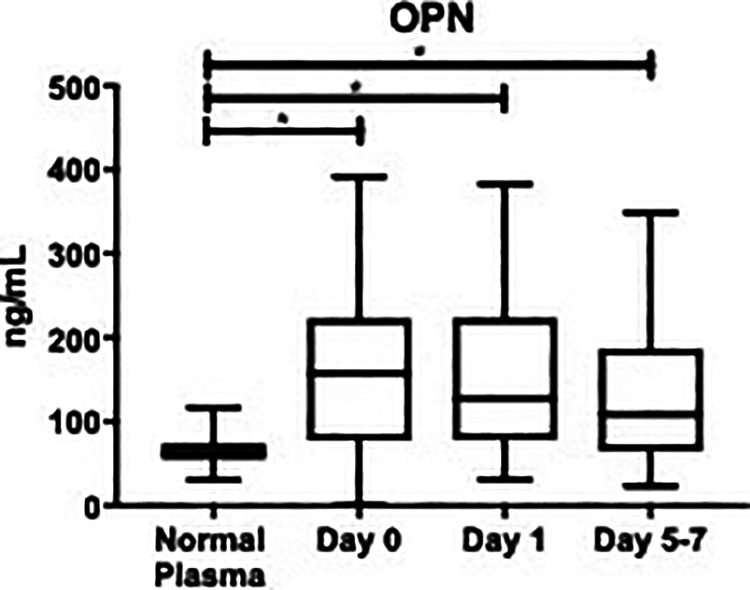
Figure 2.

Box plot showing median levels of osteopontin (OPN) stratified by draw date (day 0, day 1, day 5-7) versus controls. Boxes show interquartile ranges and I bars demonstrate highest and lowest values. Day 0 versus control, P < 0.0001; day 1 versus control, P < 0.001; day 5-7 versus control, P = 0.007; day 0 versusday 1, P > 0.999; day 0 versus day 5-7, P > 0.999; day 1 versus day 5-7, P > 0.999. (*P < 0.05).
