Figure 2.
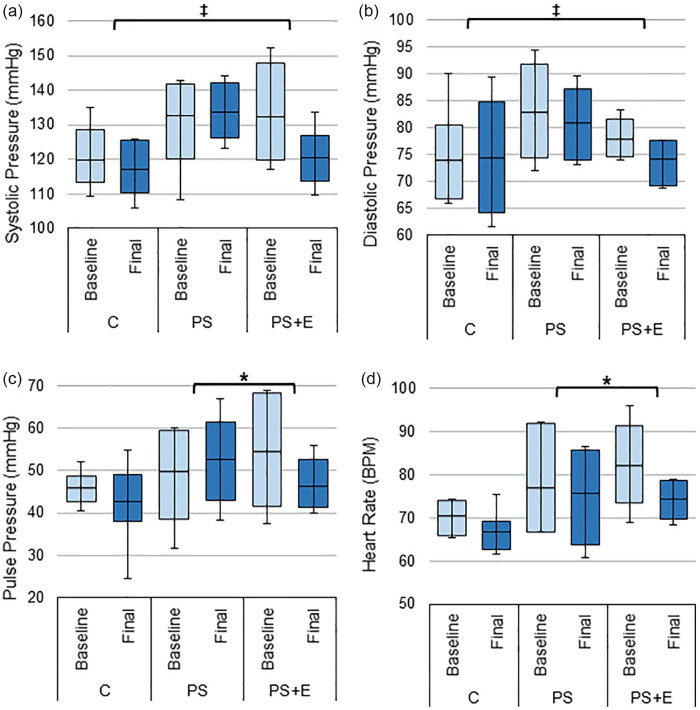
Hemodynamic changes. The average: (a) systolic pressure, (b) diastolic pressure, (c) pulse pressure, and (d) heart rate from baseline and final study visits for each treatment group.
Source. Pulse pressure is defined as systolic pressure minus diastolic pressure. Data presented as box plots with mean, 1st and 3rd quartile ranges, and maximum/minimum values.
Note. C = control; PS = protein only; PS + E = protein + exercise.
*Significantly different from PS (p-value < .05). ‡Significantly different from C (p-value < .05).

