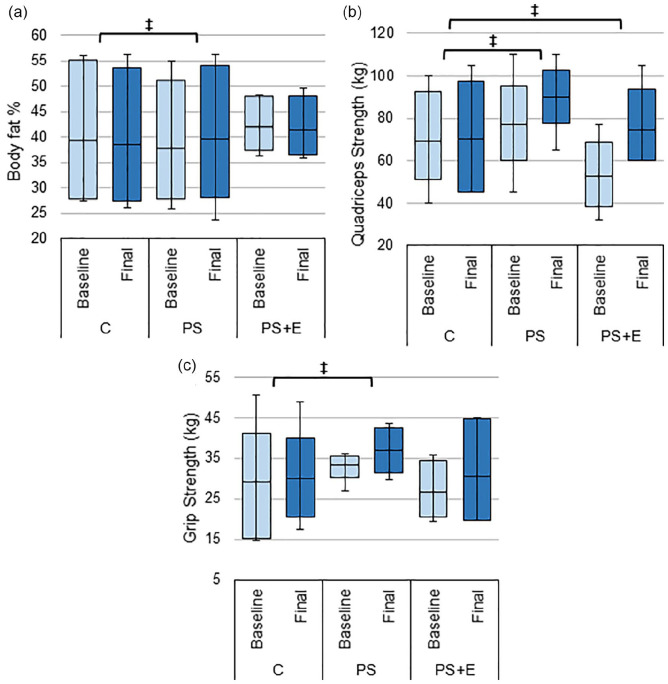
Figure 4.
Changes in composition and strength. The average baseline and final: (a) body fat %, (b) Quadriceps strength, and (c) handgrip strength test results for subjects’ dominant hand in each treatment group.
Source. Body fat % measured using handheld bioelectric impedance device. Data presented as box plots with mean, 1st and 3rd quartile ranges, and maximum/minimum values.
Note. C = control; PS = protein only; PS + E = protein + exercise.
‡Significantly different from C (p-value < .05).

