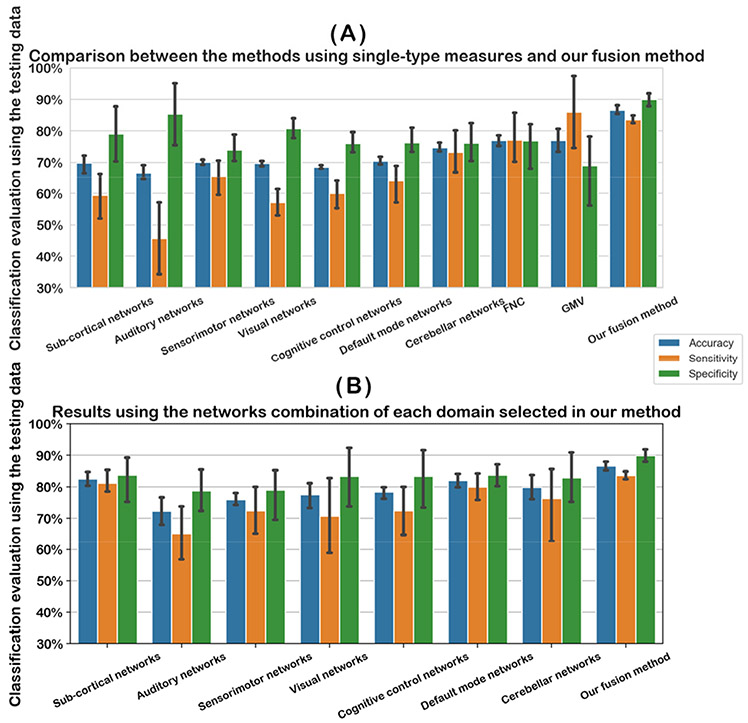
Figure 5:
Classification evaluation using the testing data. In (A), we show the classification accuracy using different single type of measures and our fusion method. Since there were different networks, we averaged the classification accuracy across different networks in each domain for a summary. In (B), we show the classification accuracy obtained using the selected networks combination of each domain in our method for a comparison. Our fusion method is shown in parallel for comparison. In (A) and (B), for the classification accuracy, sensitivity, or specificity, the evaluation metrics in different runs were shown using an error bar.

