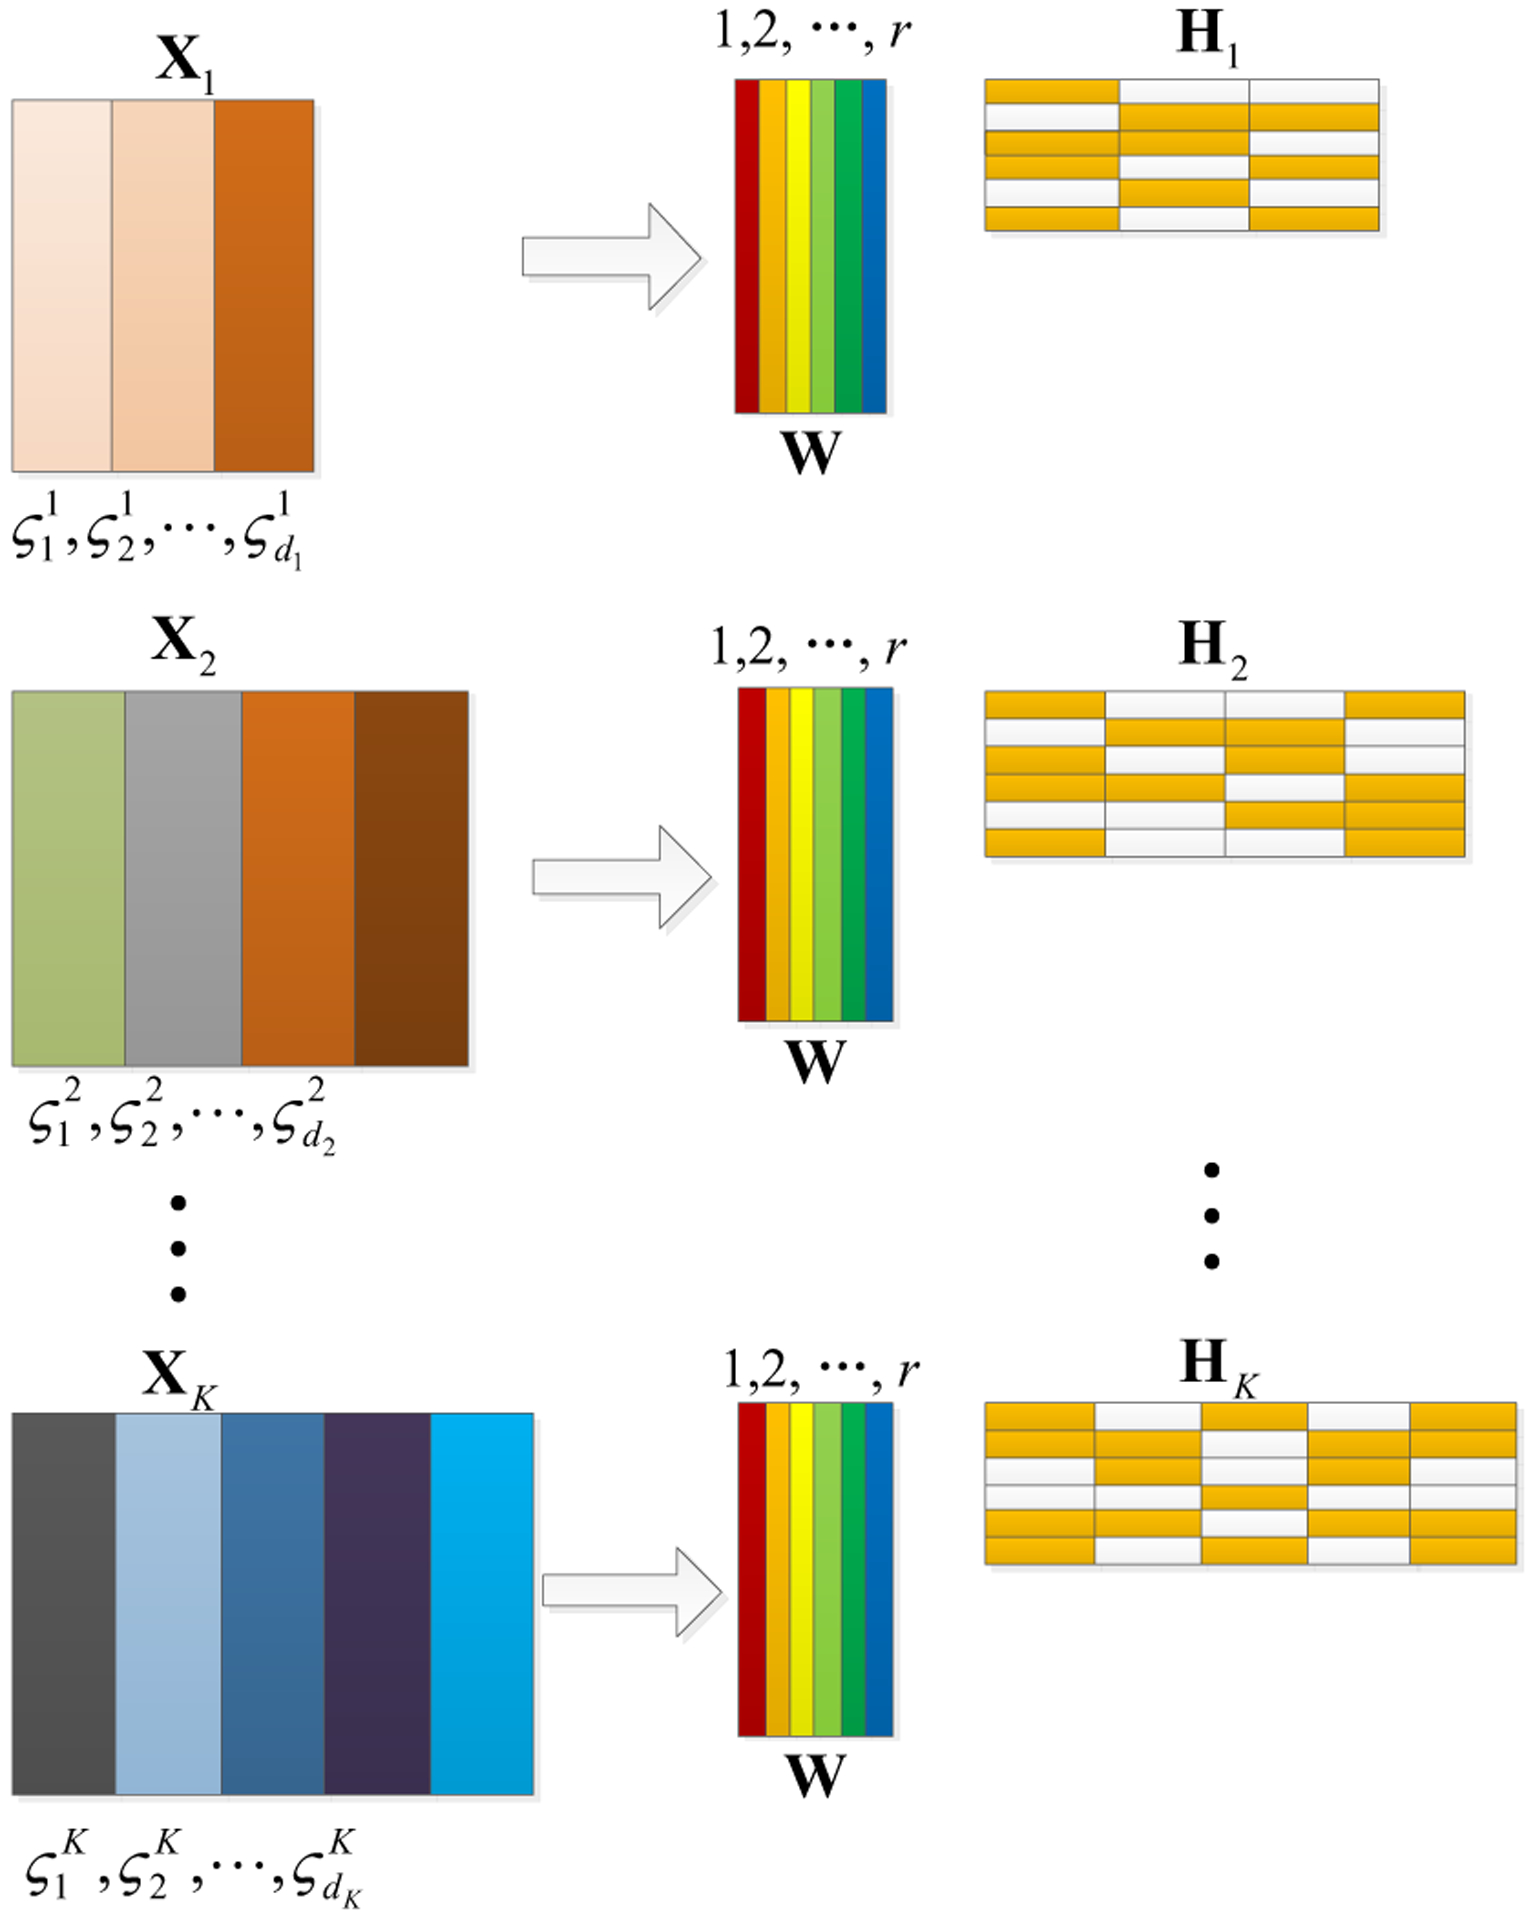
Fig. 2.

Schematic illustrating our method. Our method projects the multi-modal imaging genetics data into a common matrix and different coefficient matrices. The features of the original data XK can be divided into dK groups, which are . The yellow and white in H1, H2, …, Hk represent non-zero and zero respectively.
