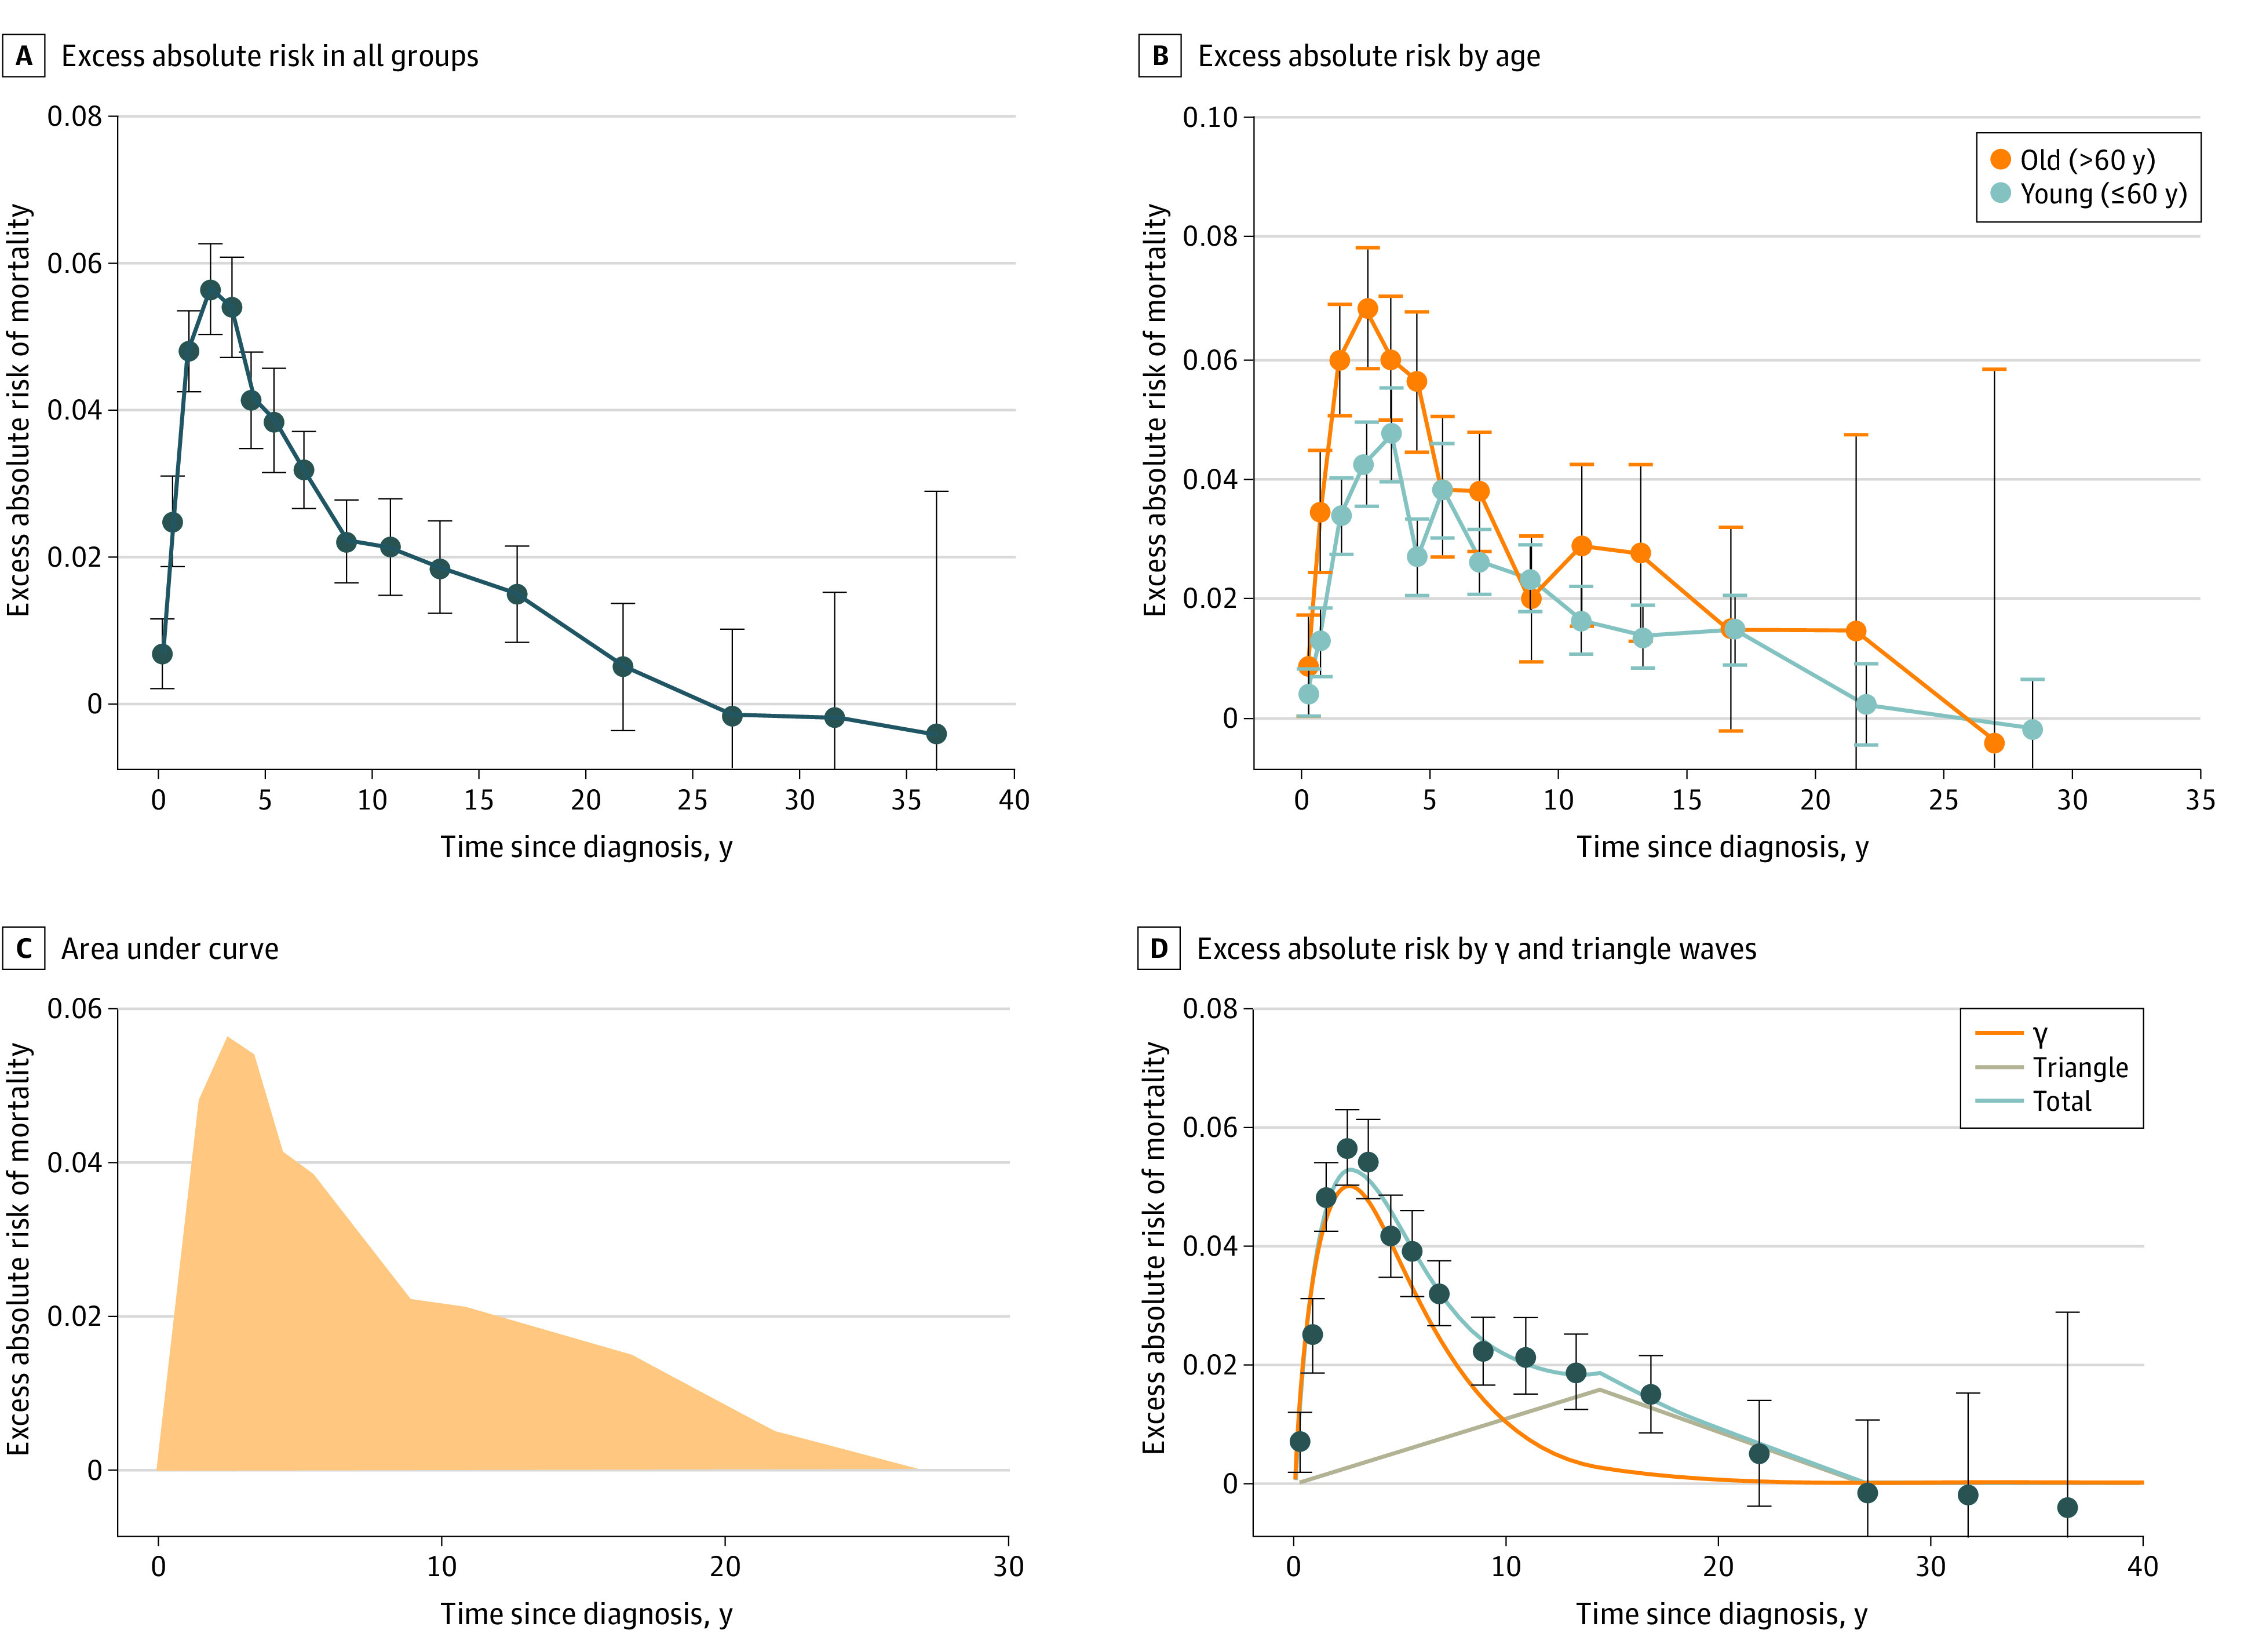
Figure 1. Surveillance, Epidemiology, and End Results (SEER) Data.

With all groups pooled (A), excess absolute risks of death (EAR) peaks to 0.056 in times greater than 2 years and 3 years or less, rapidly falls to 0.022 between 8 and 10 years, and slowly tapers thereafter to approximately 0 by year 25 (time to cure). Negative EAR estimates and 95% confidence interval values imply better-than-average survival in that interval. Person-years at risk and numbers of observed deaths in each interval are given in eTable 1 in the Supplement. The EAR amplitude depends on age (B; P < .001). The age cutoff of 60 years was chosen as an approximation of the median age of 63 years. Error bars are 95% confidence intervals. The person-years and number of observed death values are provided in eTable 2 in the Supplement. The area under the curve in (A) is 0.512 (C); therefore, cured fraction (CF) = e−0.512 = 0.60. The sum of the γ function wave and triangle wave yield a reasonable fit to pooled EAR values (D). The areas under the curve of 0.212 for the triangle wave and 0.34 for the γ wave yield a CF of e−(0.212 + 0.34) = 0.57, which is similar to the model-free estimate of 0.60 in (C).
