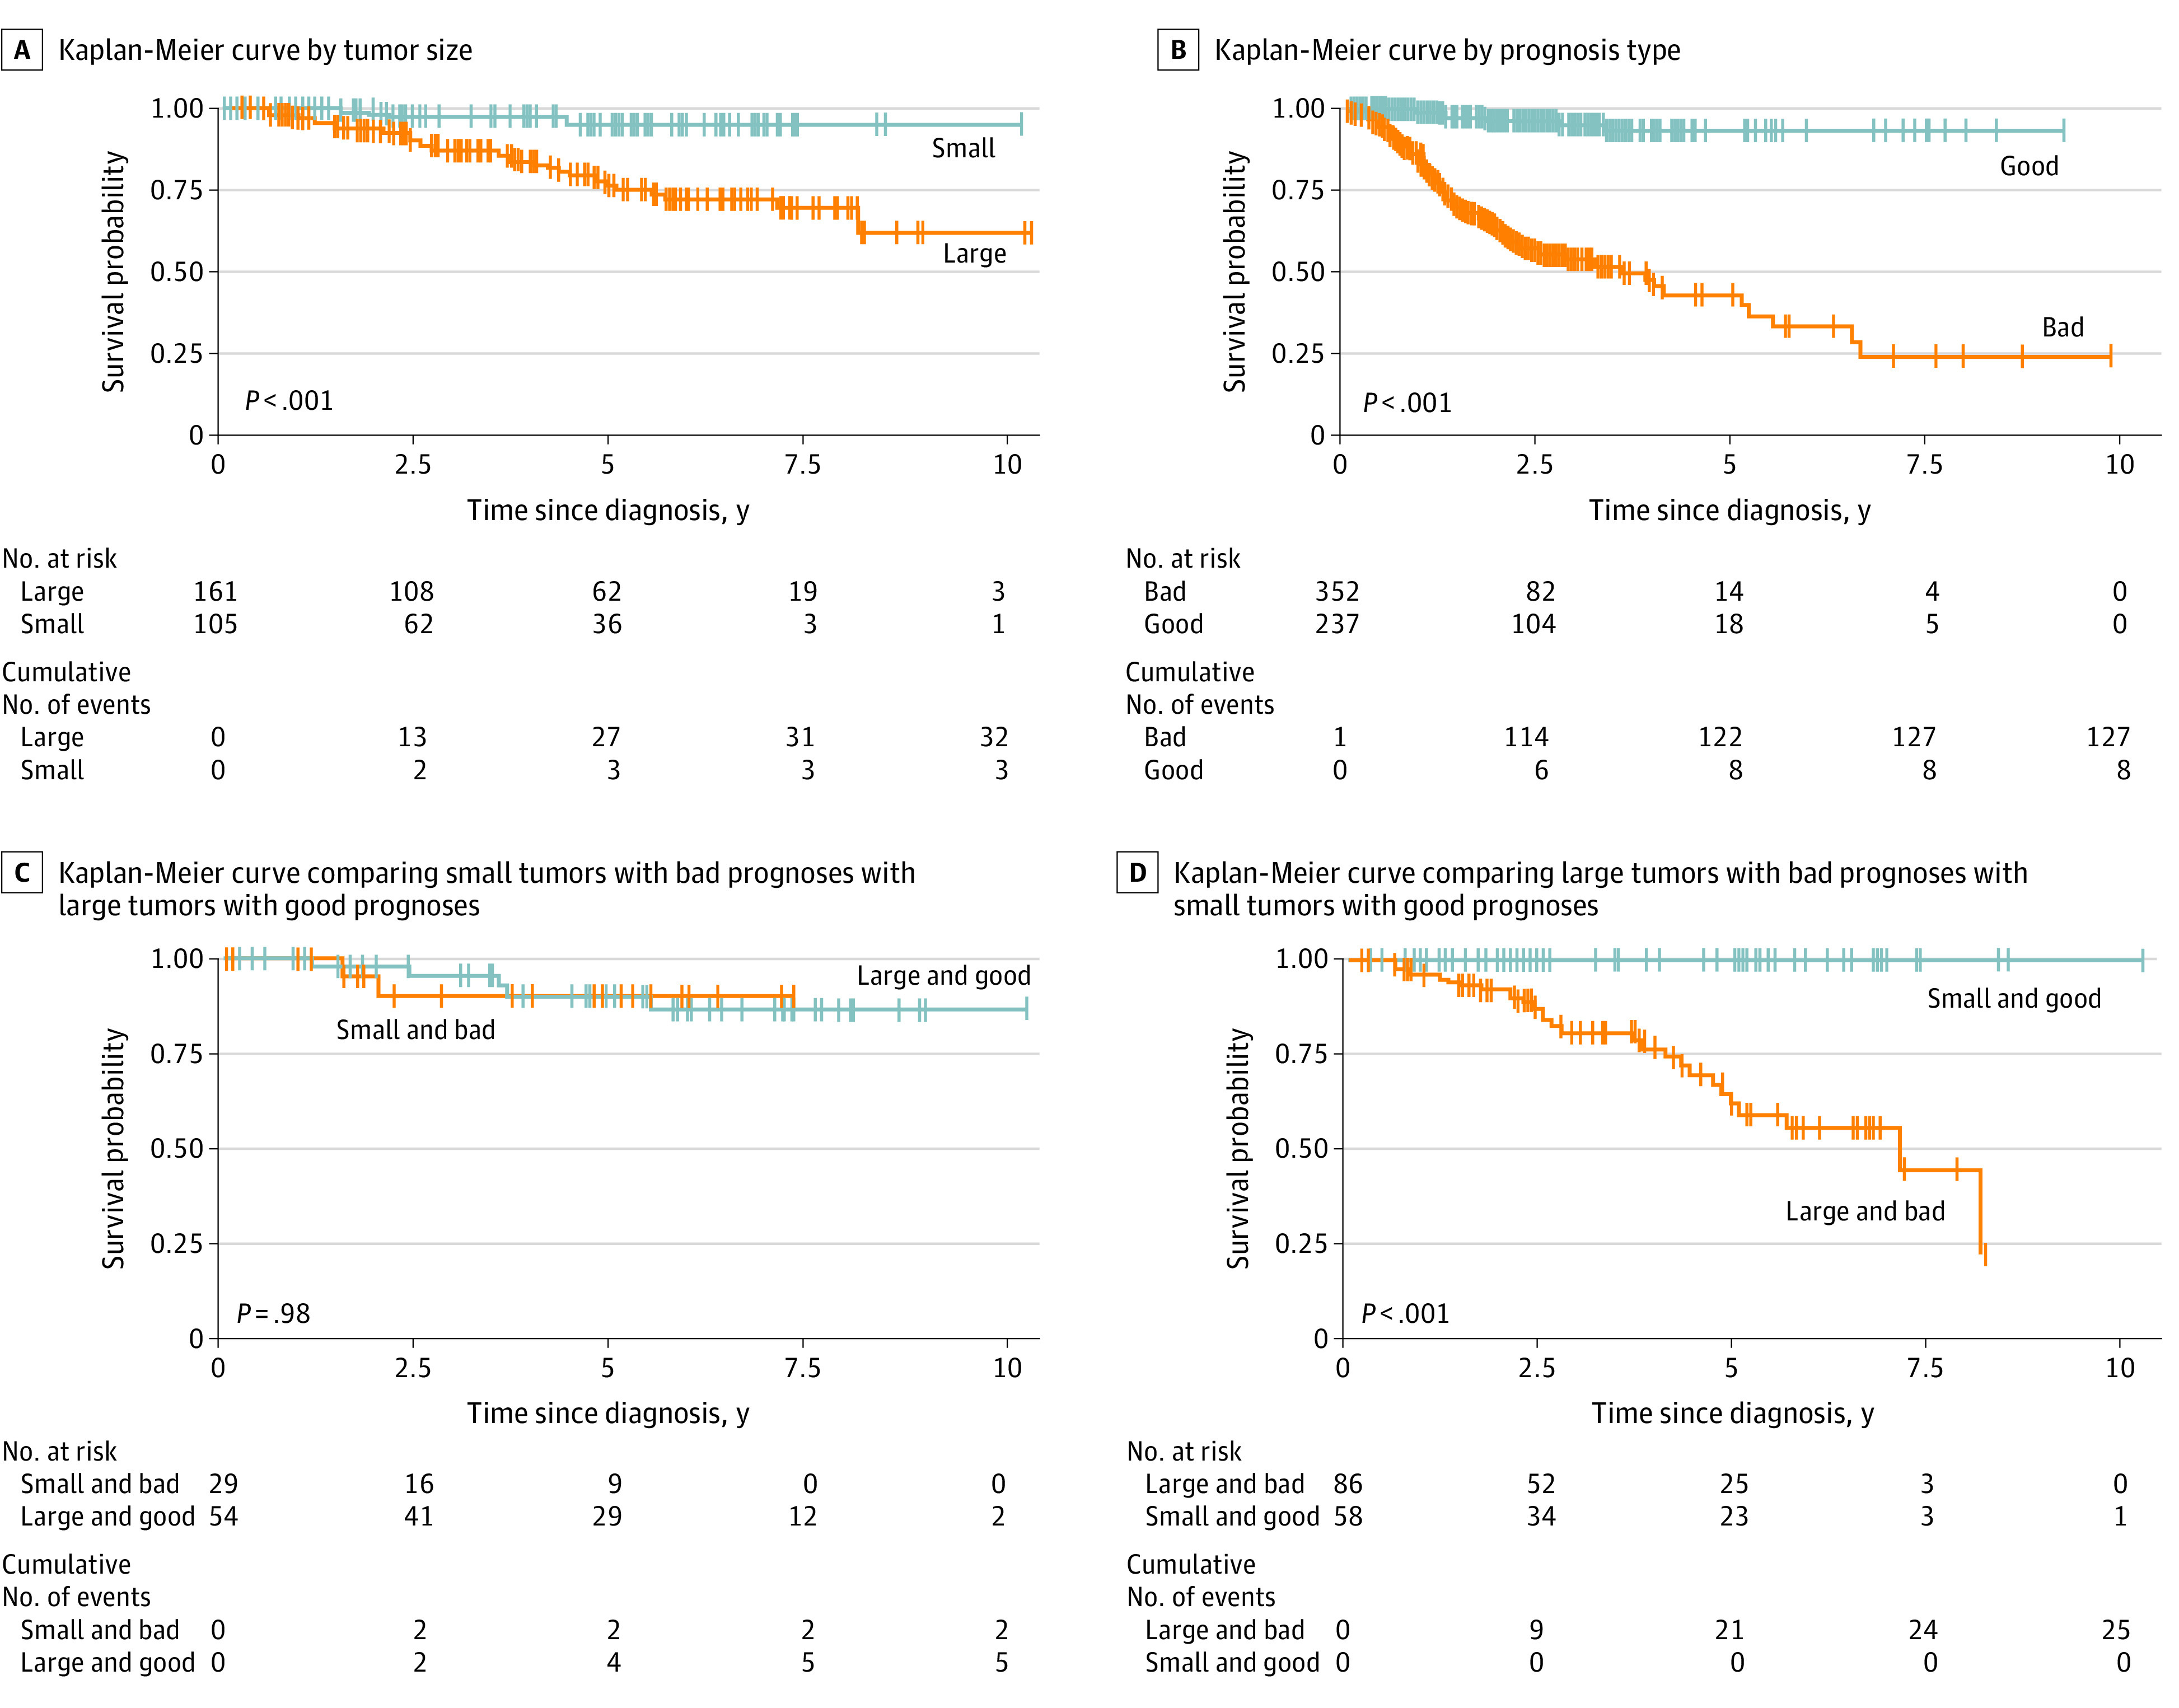
Figure 2. Kaplan-Meier Plots of Survival Probabilities of Patients in Prognostic Subsets.

Statistically significant differences in survival are evident when small tumors are compared with large tumors (A) and when good prognostic tumors are compared with bad prognostic tumors (B). No difference in survival was observed when small bad prognostic tumors were compared with large good prognostic tumors (C). None of the patients with small good prognostic tumors died of metastasis (D).
