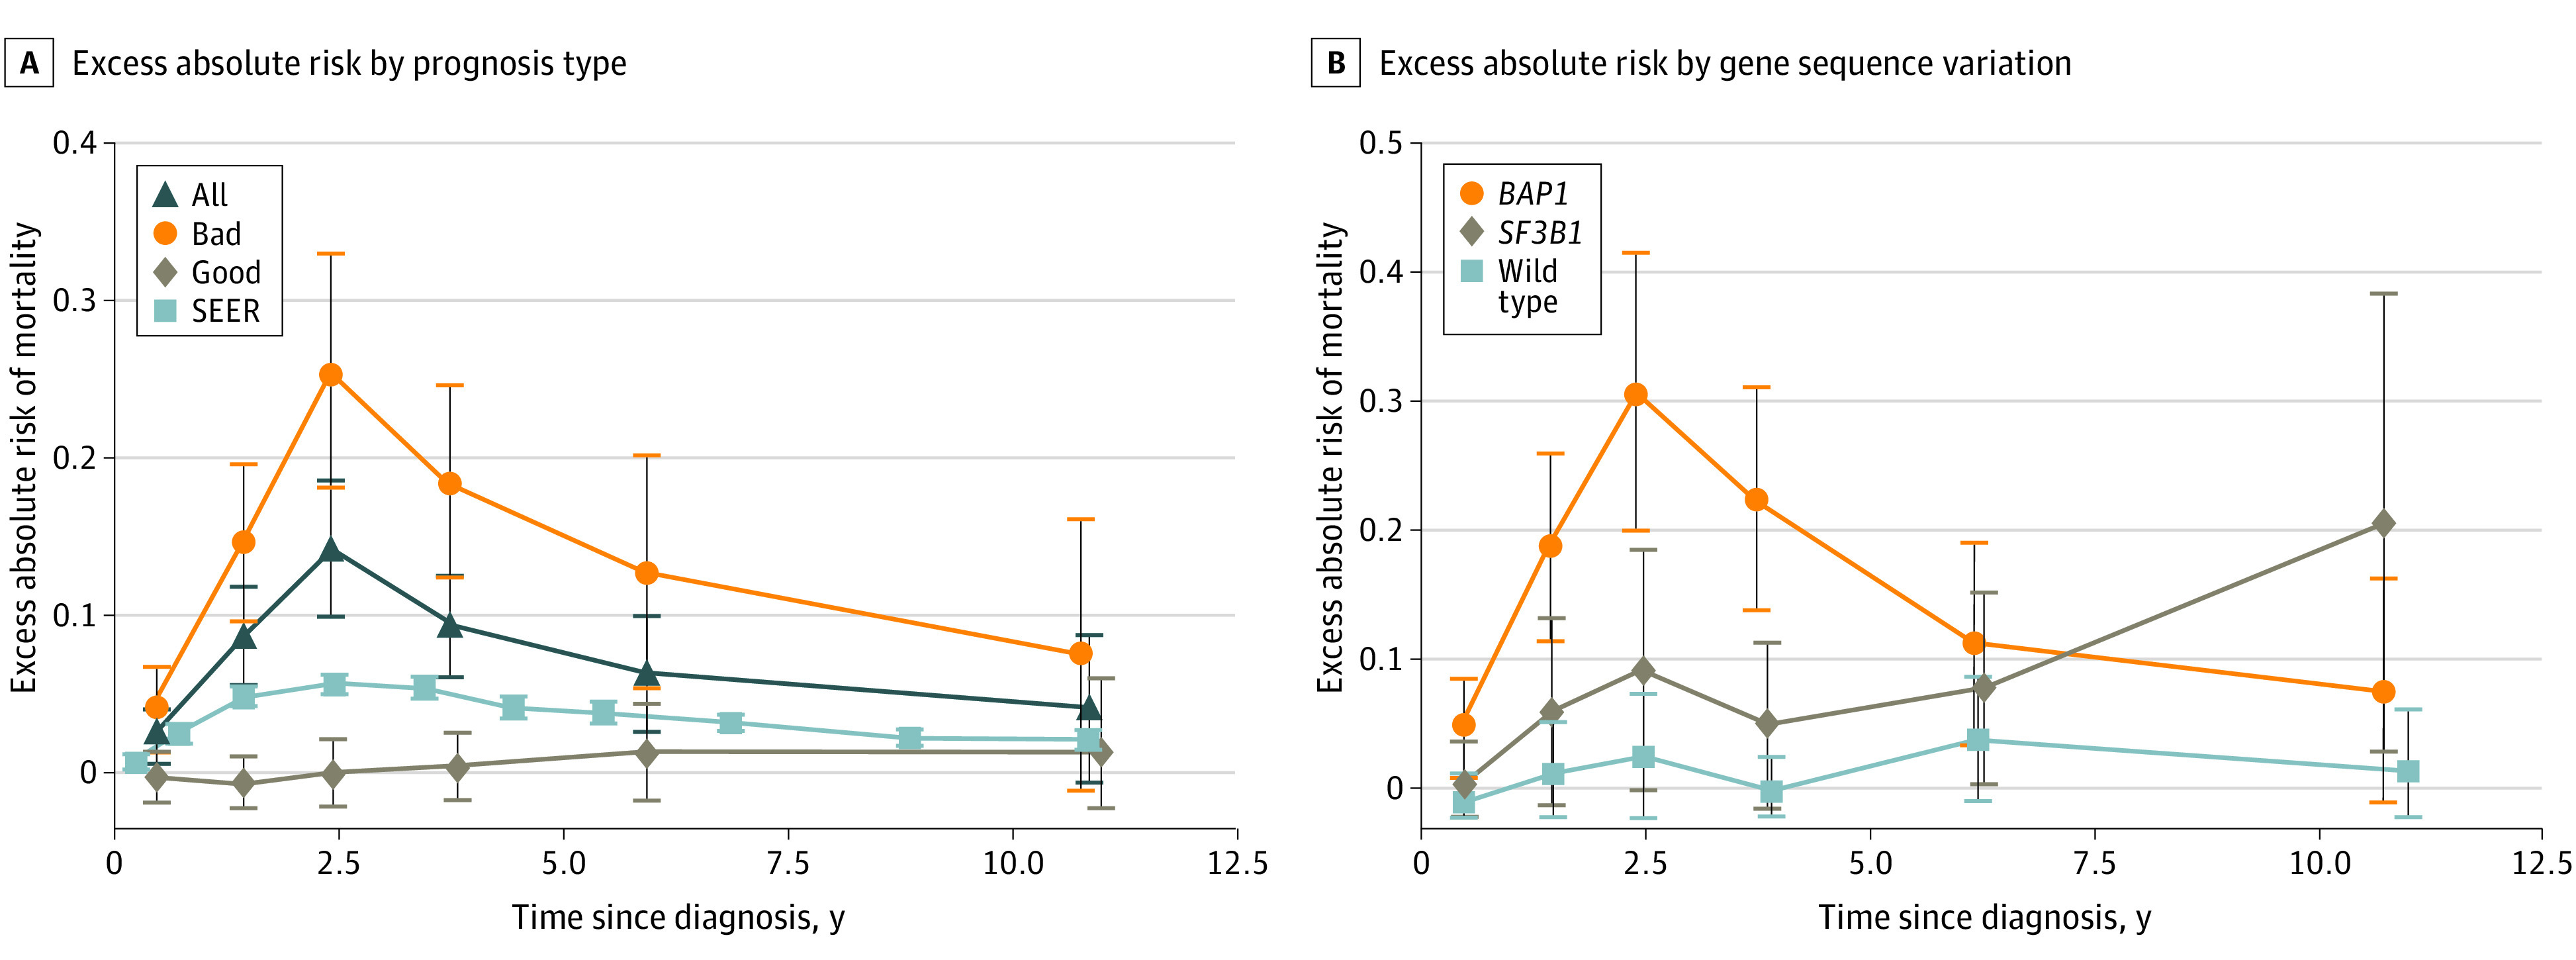
Figure 3. Excess Absolute Risks for Patients With Good Prognoses, Bad Prognoses, Both Combined (All), and Surveillance, Epidemiology, and End Results (SEER) Patients as a Reference.

The amplitude difference between the good and bad prognosis groups is significant at P < .001. The excess absolute risk time courses of BAP1 and SF3B1 mutant cases (B) are similar to the γ and triangle waveforms in Figure 1D. For observed deaths and person-years (PY) at risk in each interval, see eTables 3 and 4 in the Supplement.
