
Figure 4. Subpopulation Excess Absolute Risk (EAR) Fits.
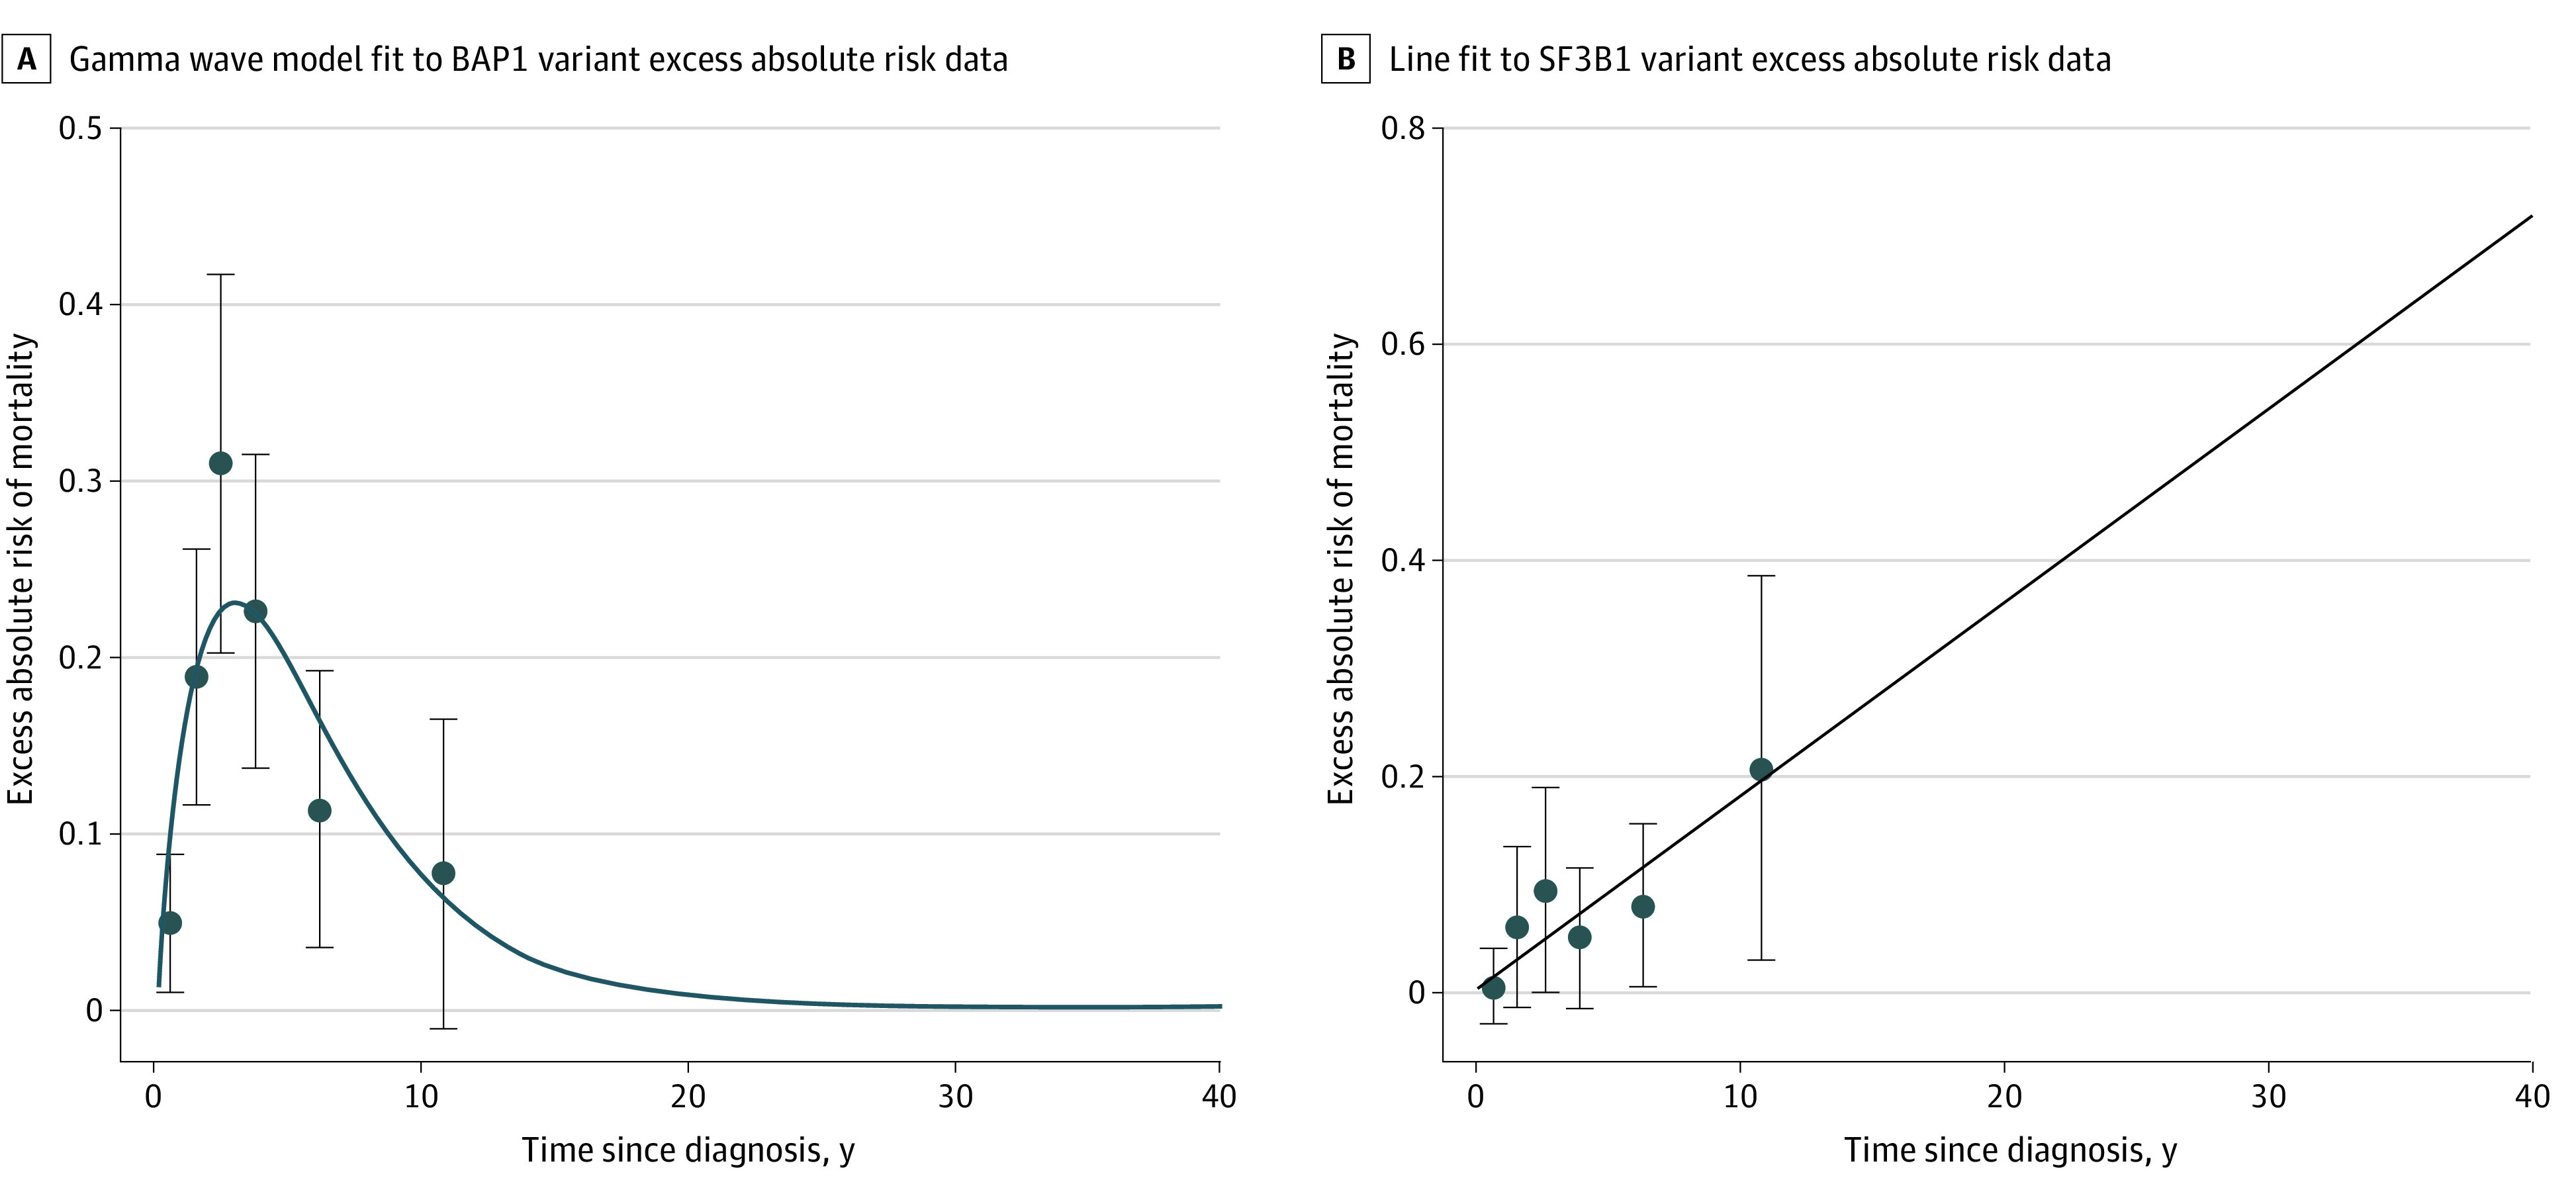
Fitting the γ wave model to BAP1 mutant EAR data yields the curve in (A) and estimates (SE) of the γ wave amplitude (c) and shape (k) parameters: c = 1.31 (0.18) and k = 0.335 (0.049). Fitting a line (though the origin) to SF3B1 mutant EAR data yields a slope of 0.018 (0.0044) (B). Data are as in Figure 3B (observed deaths and person-years at risk in each interval are provided in eTable 4 in the Supplement).