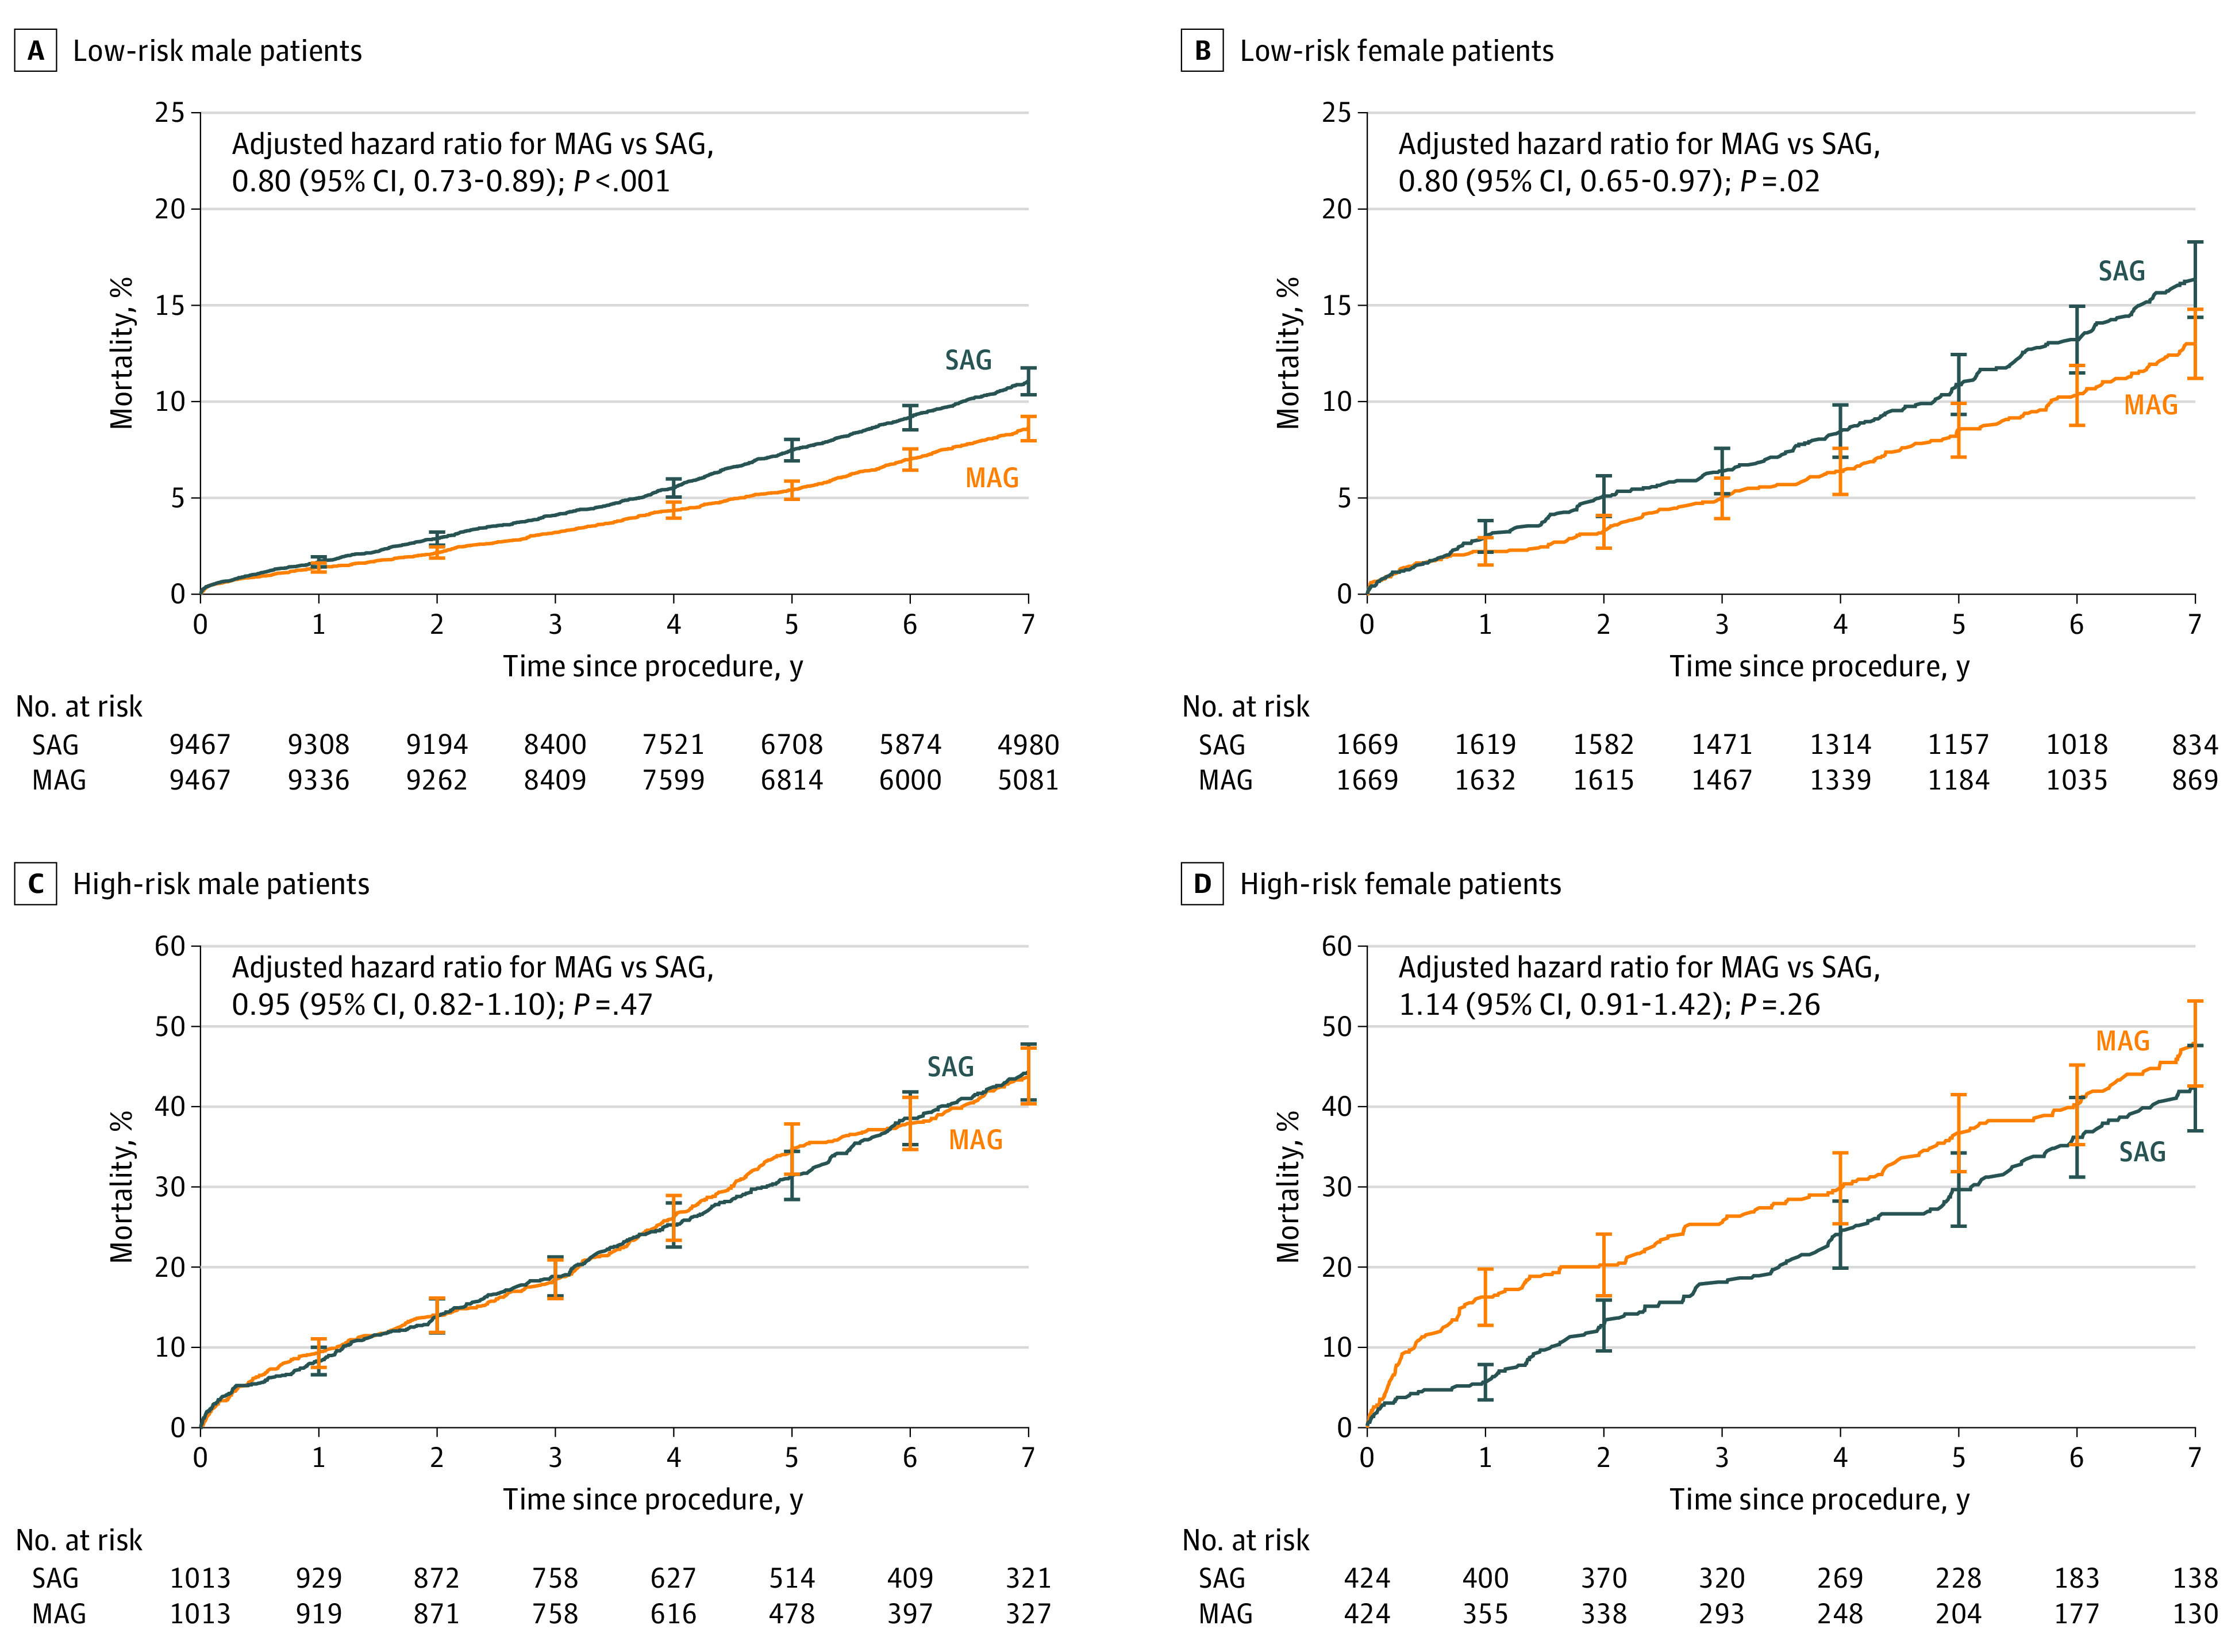
Figure 2. Seven-Year Mortality of Propensity-Matched Patients Undergoing Multiple Arterial Grafting (MAG) vs Single Arterial Grafting (SAG) Coronary Artery Bypass Grafting in New York State From 2005 to 2014.

A, Low-risk male patients. B, Low-risk female patients. C, High-risk male patients. D, High-risk female patients. Vertical lines indicate 95% CIs.
