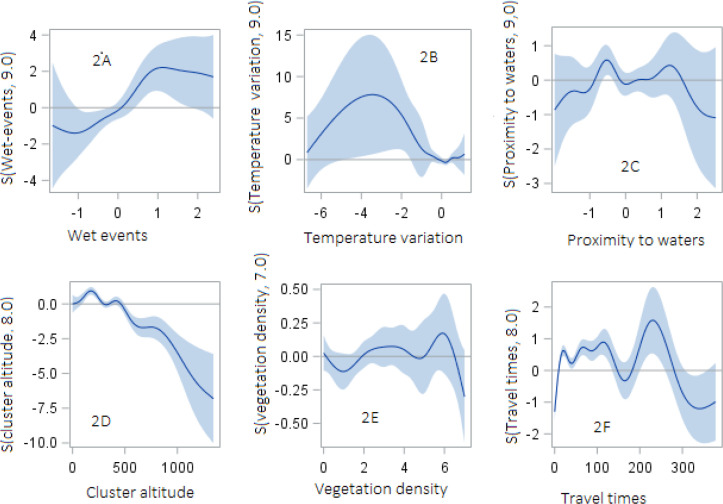
Figure 2.
Smoothing plots of relationships between under-5 malaria prevalence and climate-environmental factors in GAM with 95% confidence bands. Panel A: wet events component (precipitation, humidity, potential evapotranspiration, and wet days). Panel B: temperature variation component (maximum and minimum temperature). Panel C: distance to permanent water bodies. Panel D: cluster altitude. Panel E: enhanced vegetation index and panel F: travel times.

