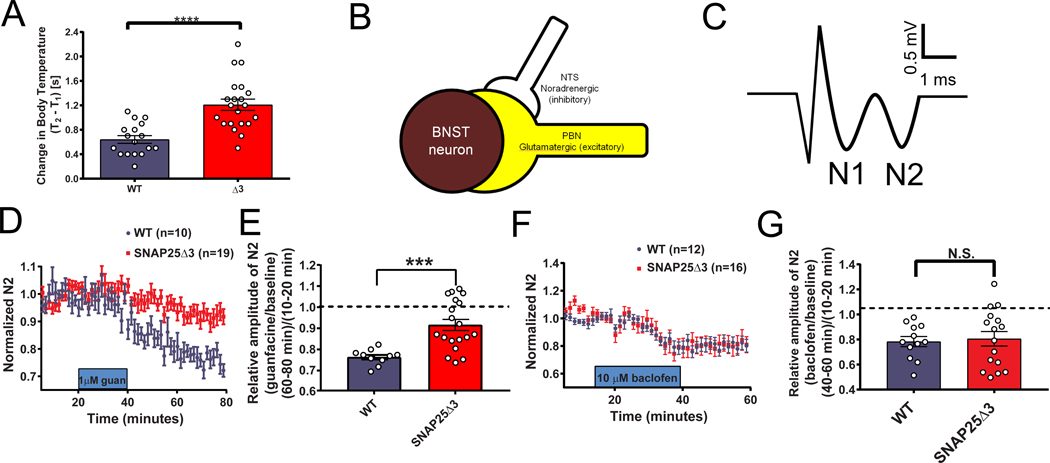
Figure 3. SNAP25Δ3 mice have altered stress responses and impaired α2a heteroreceptor signaling in the BNST.
A. Bar graph of significant changes in rectal temperature subsequent to handling in singly-housed littermate male WT (n=17 mice) and SNAP25Δ3 homozygotes (n=21 mice) of 13–14 weeks of age (****p<0.00001). B. Diagram showing synaptology of α2a heteroreceptor inhibitory signaling on excitatory parabrachial inputs on the bed nuclei of the stria terminalis. C. Example field potential from coronal brain slices containing the dorsal BNST illustrating the N1 and N2 downward deflections. D. Normalized change in the N2 component of excitatory postsynaptic potentials recorded in the BNST-containing slices taken from WT (in blue) and SNAP25Δ3 homozygote male mice (in red) at an age of >8 weeks. 1uM guanfacine was administered from t= 20 min to t= 40 min. E. Bar graph showing relative amplitude of the N2 component of EPSPs at t= 80 min as a fraction of the amplitude prior to the administration of guanfacine at t=10–20min. Guanfacine reduced the N2 component of the EPSP significantly less in slices from SNAP25Δ3 homozygotes than WT (***p < 0.001, Mann-Whitney u-test). WT: n=10 slices from 7 mice. SNAP25Δ3: n= 19 slices from 10 mice. F. Normalized change in the N2 component of excitatory postsynaptic potentials recorded in the BNST-containing slices taken from WT and SNAP25Δ3 homozygotes at an age of 8–14 weeks. 10uM baclofen was administered from t=20 min to t=40 min. G. Bar graph showing relative amplitude of the N2 component of EPSPs at t= 80 min as a fraction of the amplitude prior to the administration of baclofen at t= 10– 20min. No significant differences were observed between genotypes(p = 0.92). WT: n=12 slices from 4 mice. SNAP25Δ3: n = 16 slices from 5 mice.

