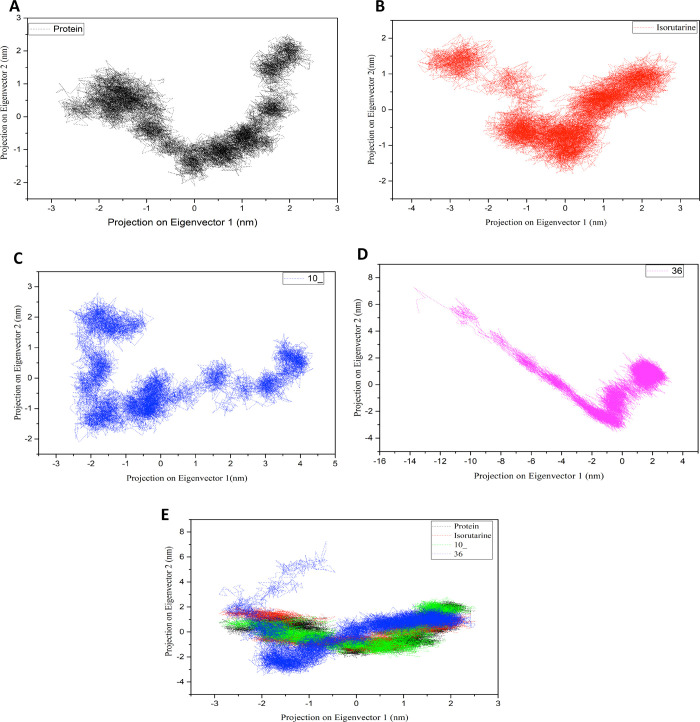
Figure 11.
Projection of the motion of the protein in the phase space along the first two principal eigenvectors at 300 K: (A) unligated protein, (B) protein ligated with isorutarine, (C) protein ligated with compound 10_, (D) protein ligated with compound 36, and (E) unligated protein (black) vs ligated protein (isorutarine – red, 10 _ – green, 36 – blue).

