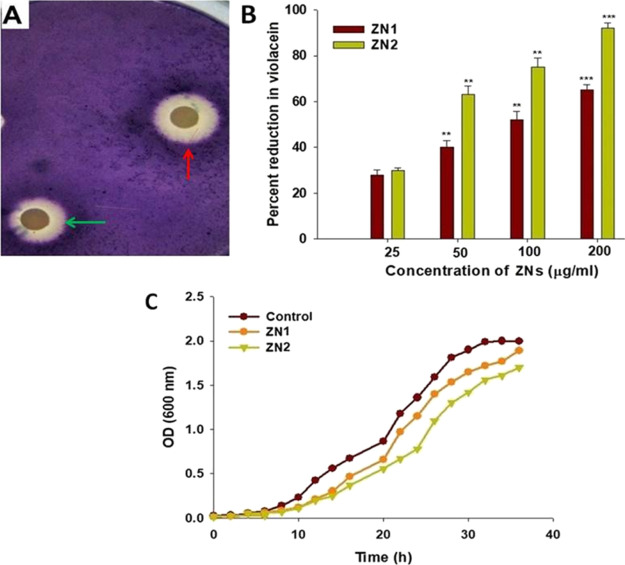
Figure 3.
Assay for QS inhibition: (A) screening for anti-QS activity using C. violaceum 12472 biosensor strain. The figure shows zone of pigment inhibition, green arrow (ZN1) and red arrow (ZN2). (B) Analysis of the growth curve of C. violaceum CVO26 at a concentration of 200 μg/mL of ZN. (C) Inhibition of violacein production in CVO26 by different ZN (ZN1 and ZN2) concentrations (25–200 μg/mL), as quantified spectrophotometrically at 585 nm.

