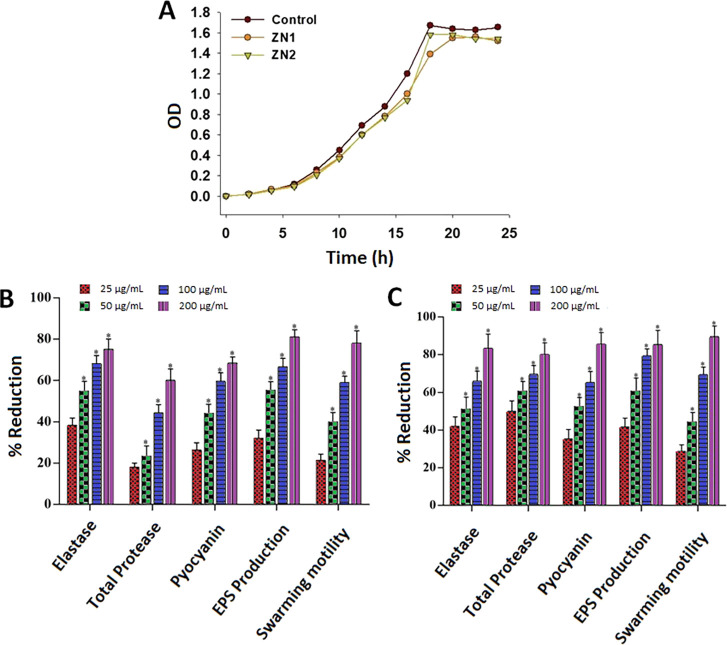
Figure 4.
QS-regulated virulence traits of PAO1: (A) analysis of the growth curve of P. aeruginosa PAO1 incubated with ZN at a 200 μg/mL concentration. Effects of sub-MICs of (B) ZN1 and (C) ZN2 on inhibition of the QS-regulated virulence factor. Data are expressed as mean % reduction ± SD. *≤ 0.05, **≤ 0.005, and ***≤ 0.001 vs control.

