Figure 2.
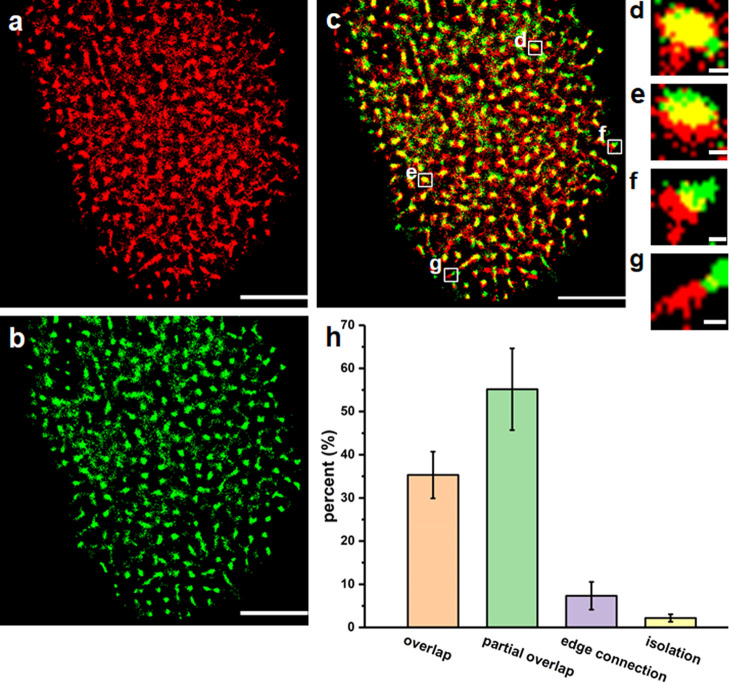
Colocalization of Trop2 and lipid rafts on the apical membranes of A549 cells. (a,b) dSTORM images of lipid rafts (a) and Trop2 (b). (c) Merging images of lipid rafts (red) and Trop2 (green). (d–g) Magnified view of four representative location relationships of lipid rafts and Trop2 boxed in (c): overlap (d), partial overlap (e), edge connection (f), and isolation (g). Scale bars: 5 μm in (a–c) and 200 nm in (d–g). (h) Percentage of the four types of location states. Data were from 500 random cluster pairs in 10 cells in 5 independent experiments.

