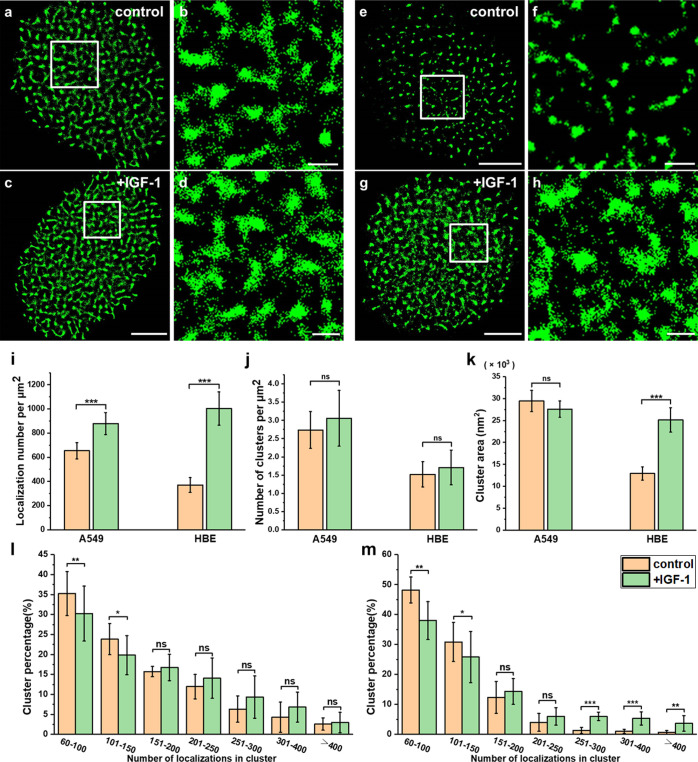
Figure 5.
IGF-1 stimulation caused different changes of Trop2 clusters in cancer cells and normal cells. (a–d) Reconstructed dSTORM images of Trop2 on control (a) and IGF-1-treated (c) A549 cell membranes and the corresponding magnified images (b,d). (e–h) Reconstructed dSTORM images of Trop2 on control (e) and IGF-1 treated (g) HBE cell membranes and the corresponding magnified images (f,h). Scale bars: 5 μm in original images and 1 μm in magnified images. (i) Number of Trop2 localizations per μm2 on A549 and HBE cells with or without IGF-1 stimulation. (j) Cluster area. (k) Number of clusters per μm2. (l,m) Percentage of clusters containing different number of localizations on (l) A549 cells and (m) HBE cells. All results were obtained from 10 cell samples in 5 independent experiments. Statistical significance was processed by two-tailed unpaired t-test. *P < 0.05, **P < 0.01, ***P < 0.001, and ns means not significant.

