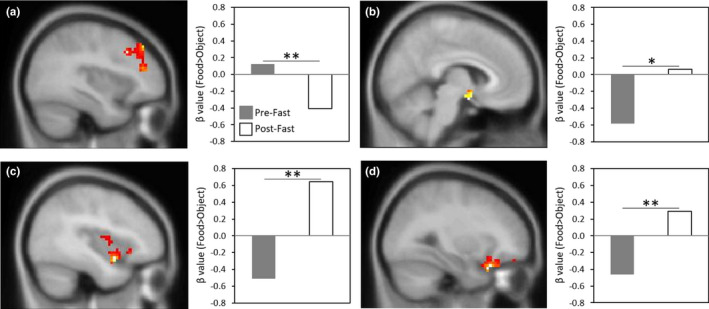
FIGURE 2.

Change in Neural Response to Food versus Objects before and after Fasting. For each ROI, figures show SPM maps of BOLD activation at p FWE < 0.05 in response to Food > Objects from Pre‐ to Post‐Fast, overlaid on the avg152T1 template. Bar graphs on the right of each figure visually present the mean BOLD response to the Food > Object contrast within clusters meeting statistical thresholds (defined in the Methods; see Table 2 for MNI coordinates) for the Pre‐Fast (gray bar) versus Post‐Fast (white bar) comparison: (a) left DLPFC; (b) right hypothalamus; (c) left insula; (d) right OFC. *p = .05, FWE‐corrected; **p < .05, FWE‐corrected
