
Figure 5.
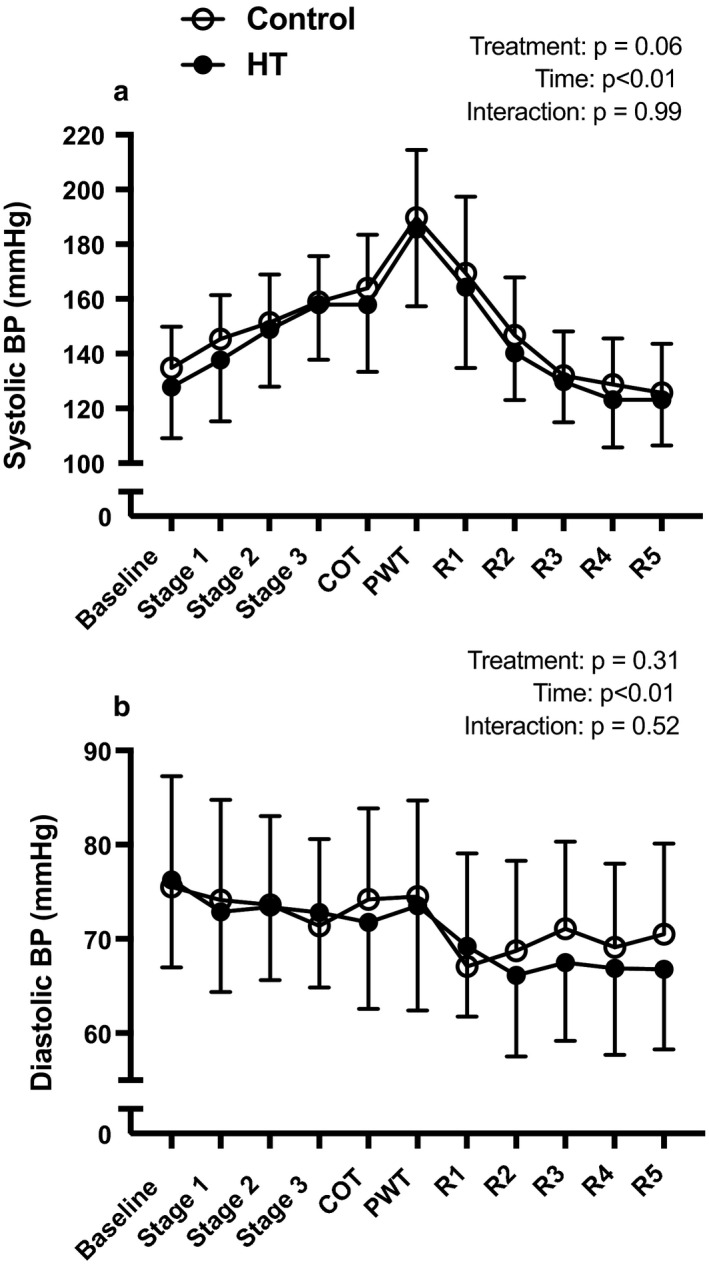
Mean systolic blood pressure (panel a) and diastolic blood pressure (panel b) during exercise after exposure to 90 min of HT (closed circles) or CON (open circles). Values are as means ± SD. Data were analyzed using a two‐way repeated‐measures analysis of variance (ANOVA). COT, claudication onset time; PWT, peak walking time; R1, recovery stage 1; R2, recovery stage 2; R3, recovery stage 3; R4, recovery stage 4; R5, recovery stage 5