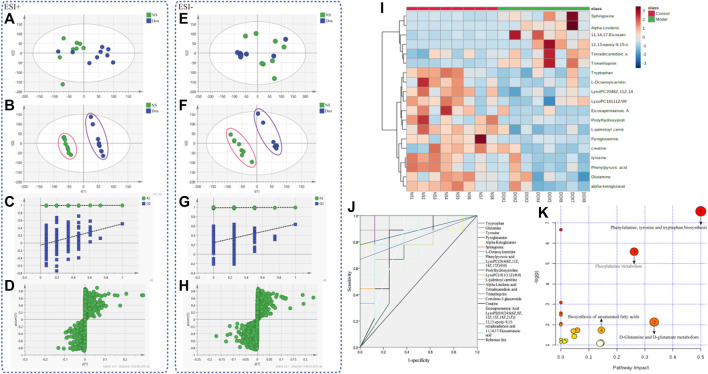
FIGURE 2.
The metabolic profiles and metabolite analysis of plasma samples. (A) PCA score plots (ESI+) for comprehensive metabonomic data of plasma samples. Models include the control and DOX-treated rat (3 mg/kg). (B) PLS–DA models (ESI+) of UPLC-Q-TOF/MS metabonomics data for NS group and models include the control and DOX-treated rat (3 mg/kg). (C) Model validation diagram in positive ion mode. (D) S–plot load diagram in positive ion mode. (E) PCA score plots (ESI–) for comprehensive metabonomic data of plasma samples. Models include the control and DOX-treated rat (3 mg/kg). (F) PLS–DA models (ESI–) of UPLC-Q-TOF/MS metabonomics data for NS group and models include the control and DOX-treated rat (3 mg/kg). (G) Model validation diagram in negative ion mode. (H) S–plot load diagram in negative ion mode. (I) Heat map for metabolites. (J) Diagnostic significance of ROC curve analysis for metabolites. (K) Metabolic pathway map analysis.

