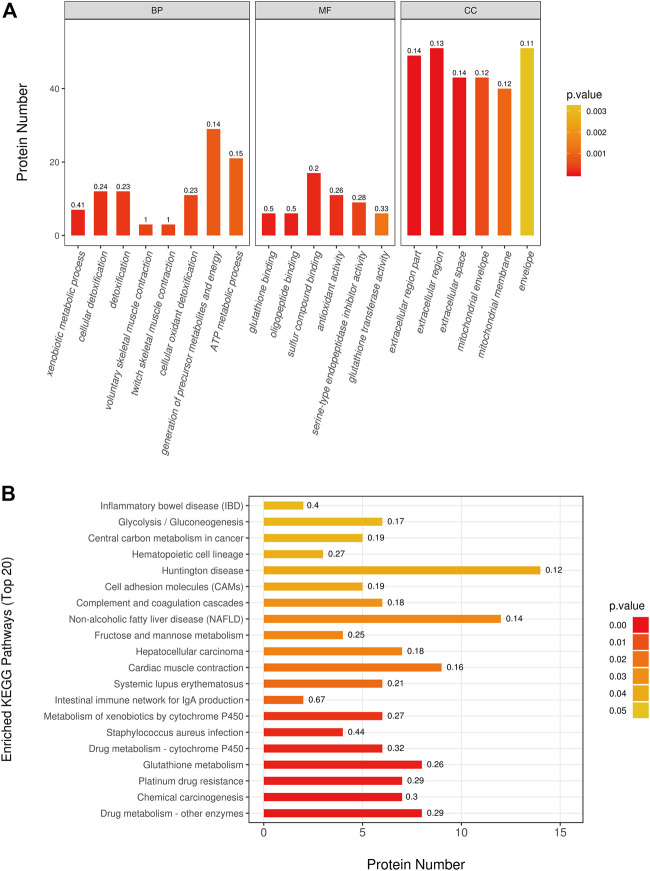
FIGURE 3.
Differentially expressed proteins pathway enrichment analysis. (A) The most significantly (p < 0.05) enriched GO terms (Top 20) in rat treated with doxorubicin. (B) The most significantly (p < 0.05) enriched KEGG pathways (Top 20) in rat treated with doxorubicin. (BP: biological process; MF: molecular function; CC: cellular component).

