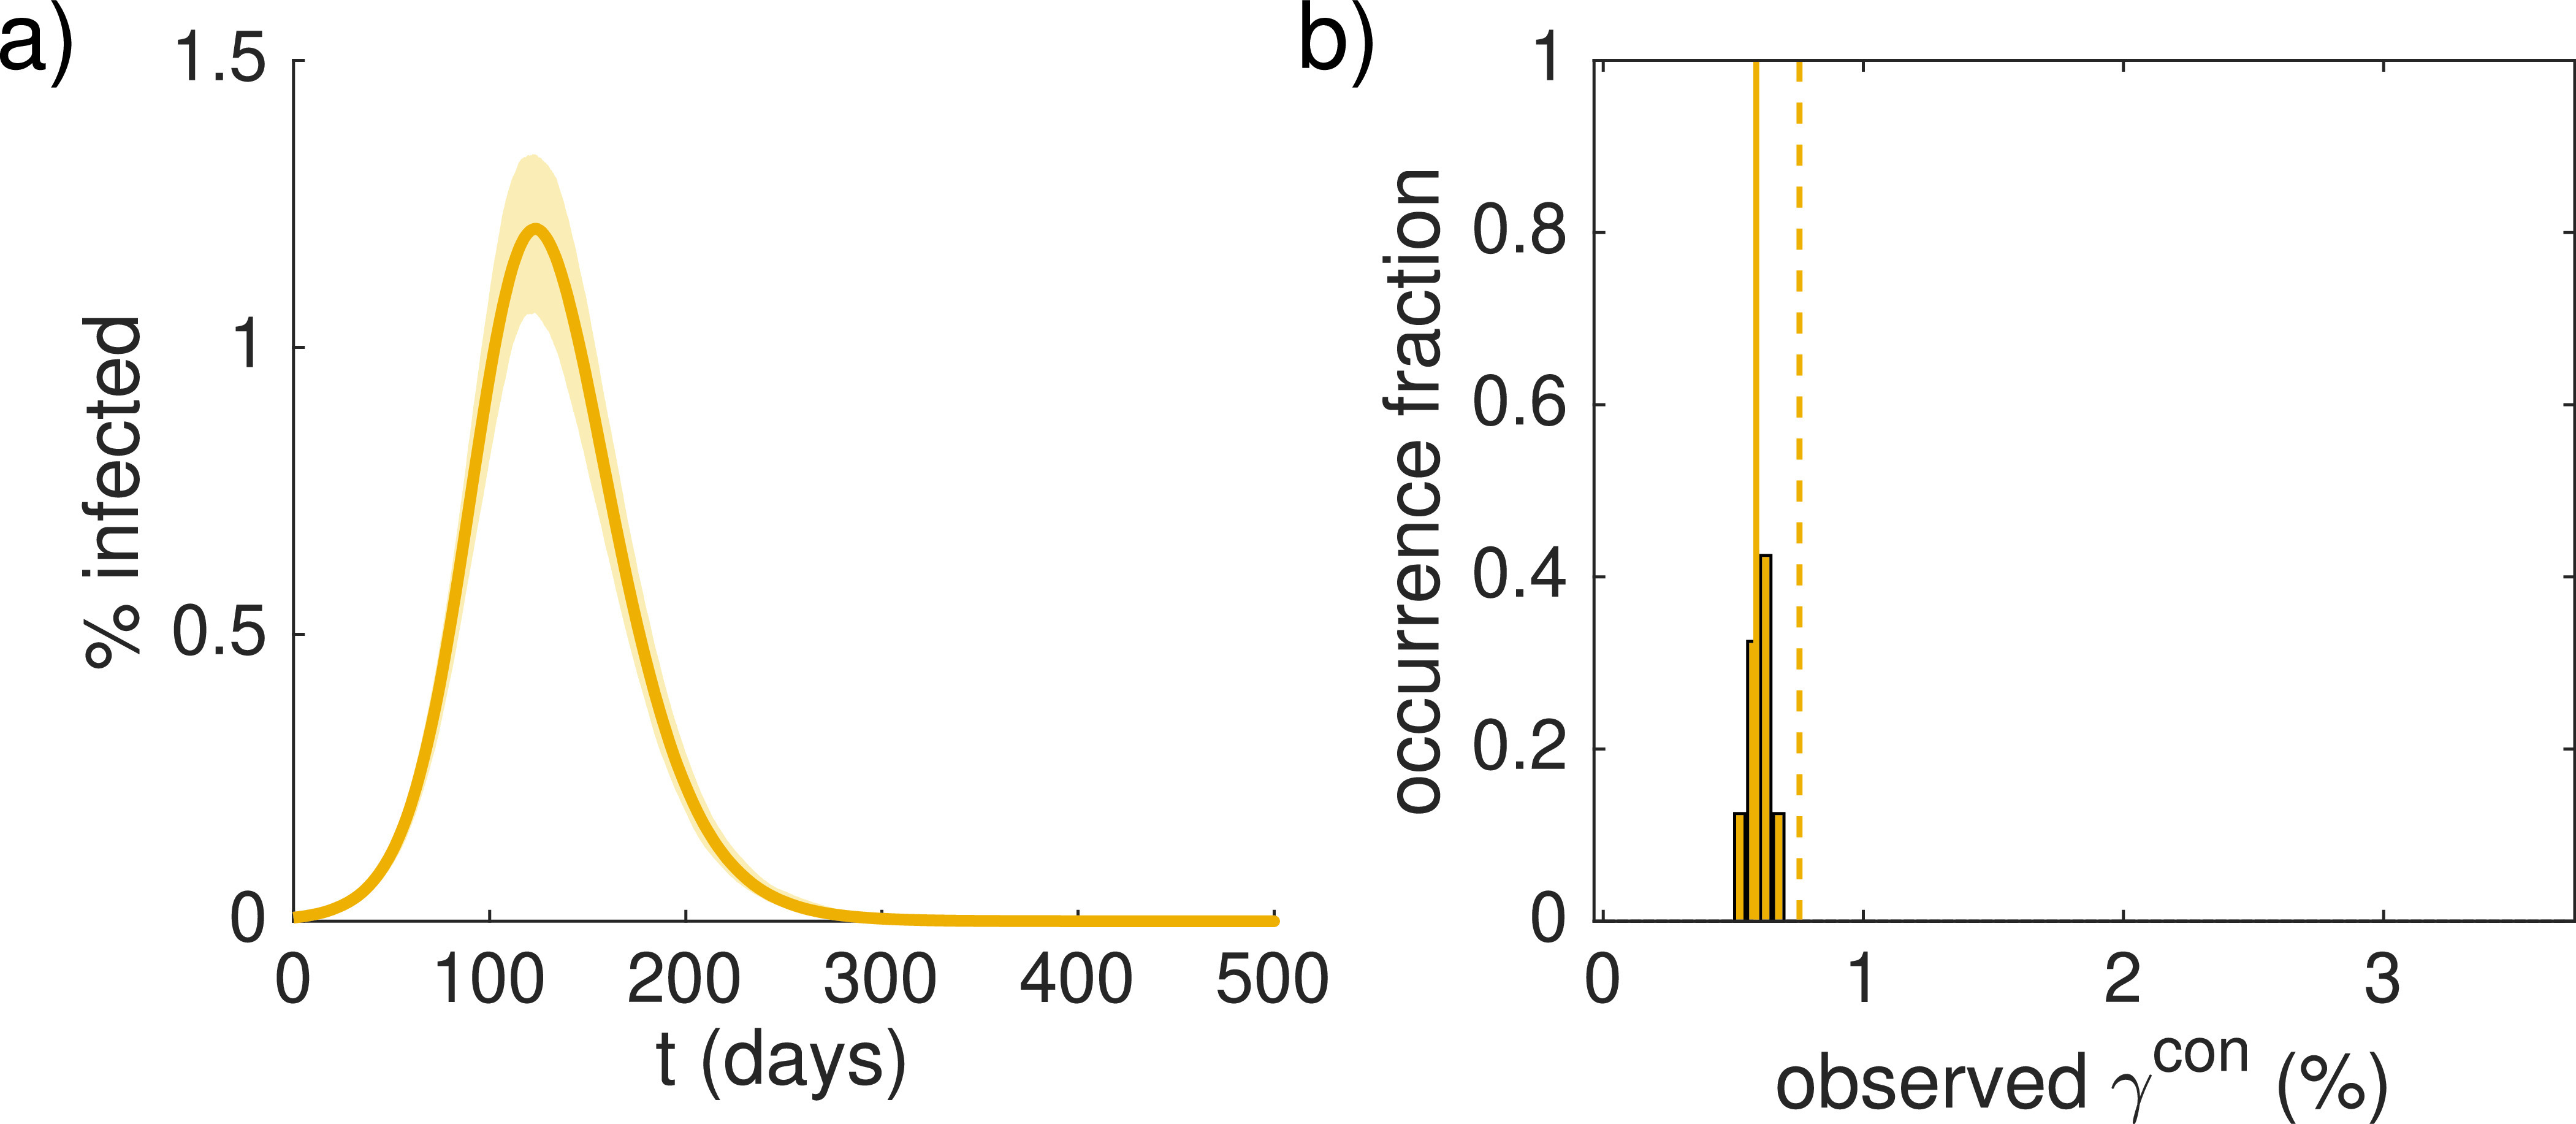
FIG. 3.

Plots analogous to Figs. 2(a) and 2(b) for the case , but with exactly one initially infected individual in each sub-population instead of a random distribution. Analytical estimates, Eq. (6) (dashed line) and Eq. (9) (solid line), accordingly use .
