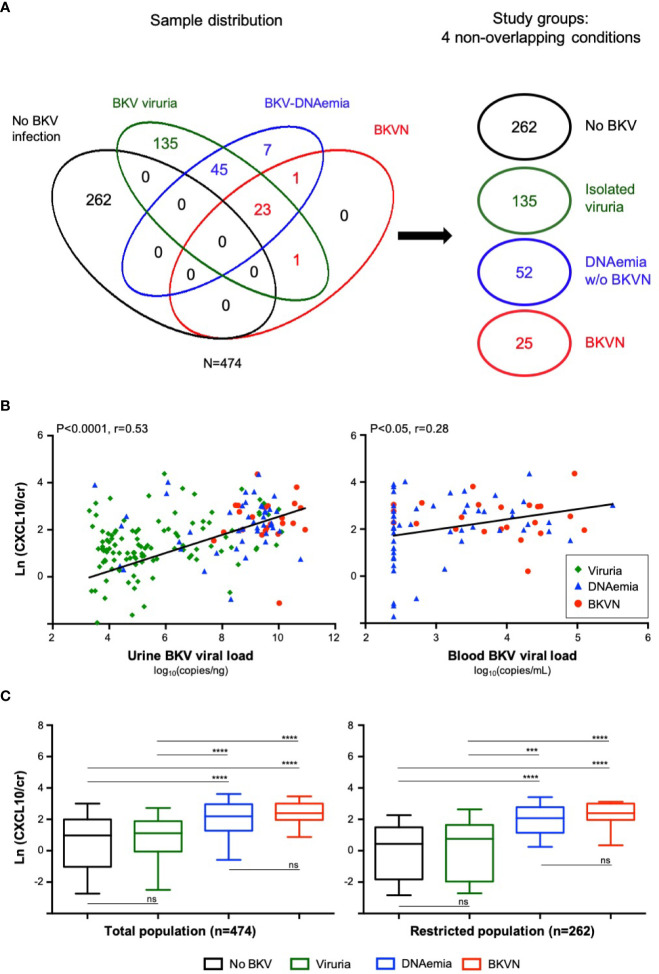
Figure 2.
Sample distribution and chemokine levels in the cross-sectional study (A). Euler diagram illustrating the sample distribution according to detection of viruria, BKV-DNAemia and histological diagnosis of BKVN and the constitution of four non-overlapping groups according to BKV status: no BKV infection, BKV viruria, BKV-DNAemia without BKVN and BKVN (B). Urine BKV viral load among the different groups (viruria, BKV-DNAemia and BKVN) and its correlation with uCXCL10/cr levels. Similarly, the blood BKV viral load in the BKV-DNAemia and BKVN groups and its correlation with uCXCL10/cr levels is shown. Correlations were computed from Pearson’s test (C). Urinary CXCL10 levels according to the 4 BKV groups in the total population and in a restricted population after exclusion of confounding factors. In this restricted population, we excluded samples with significant UTI, with no cytobacterial examination available, with a concurrent acute rejection diagnosis or with inadequate biopsy. P-values were obtained from a Kruskal-Wallis test followed by Dunn’s multiple comparisons ***P < 0.001; ****P < 0.0001. BKVN, BKV-associated nephropathy; Cr, urinary creatinine; Ln, natural logarithm; UTI, urinary tract infection; ns, not significant.

