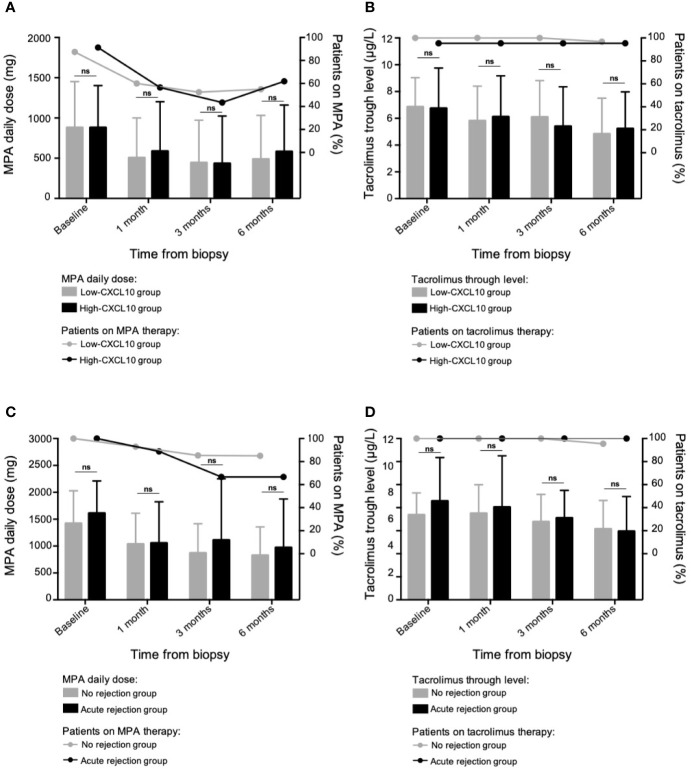
Figure 4.
Tapering of the maintenance immunosuppressive regimen. In the case-control study (63 patients with BKV-DNAemia), evolution of the mycophenolic acid daily dose (A) and the tacrolimus trough levels (B) at different time points following BKV-associated biopsy according to the uCXCL10/cr group. The low-CXCL10 group was defined by uCXCL10/cr ≤12.86 ng/mmol, and the high-CXCL10 group was defined by uCXCL10/cr >12.86 ng/mmol. In the longitudinal study (60 patients with BKV-DNAemia), evolution of the mycophenolic acid daily dose (C) and the tacrolimus trough levels (D) at different time points following the 1st positive BKV viral load and according to the occurrence of subsequent rejection. Data are presented as the mean ± SD values. P-values were obtained via the Mann–Whitney test. The proportions of patients on or off each treatment were compared using Fisher’s exact test in Panels (A–D) without any significant differences. MPA, mycophenolic acid; ns, not significant; SD, standard deviation.

