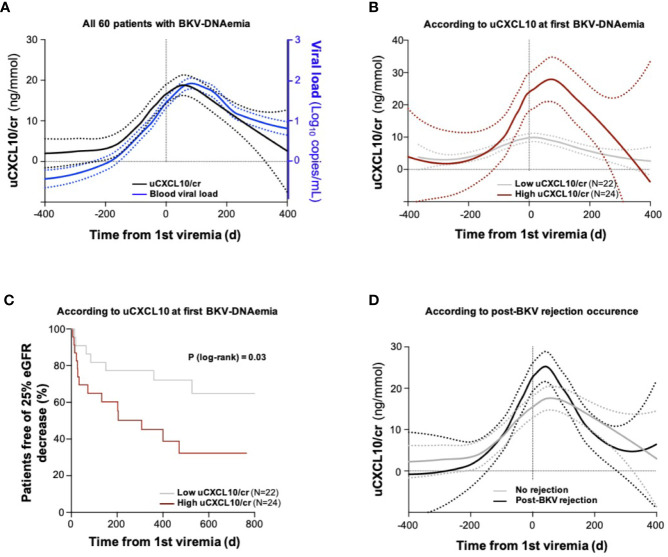
Figure 5.
Longitudinal study of urinary CXCL10 in BKV viremic patients (A). Urinary CXCL10/cr and blood BKV viral load trajectory analyses in the longitudinal cohort including 60 single patients with BKV-DNAemia. Trajectories were computed by regression from longitudinal assessments of uCXCL10/cr (samples collected at biopsy and each outpatient clinic visit during the 1st year post-transplantation, black line) and all available blood BKV viral loads over the same period (blue line). Dotted lines indicate the confidence interval of each group (B). Urinary CXCL10/cr trajectory according to uCXCL10/cr threshold at first BKV-DNAemia. The low-CXCL10 group (gray line) is defined by uCXCL10/cr ≤12.86 ng/mmol, and the high-CXCL10 group is defined by uCXCL10/cr >12.86 ng/mmol (burgundy line) (C). Kaplan-Meier curves illustrating survival before the occurrence of a 25% eGFR decrease in the low-CXCL10 (gray curve) and high-CXCL10 (burgundy curve) groups. The P-value was computed from a log-rank test (D). Patients were divided according to the occurrence of a post-BKV acute rejection episode (black line) or not (gray line). Dotted lines indicate the confidence interval of each group. cr, urine creatinine; d, days; eGFR, estimated glomerular filtration rate.

