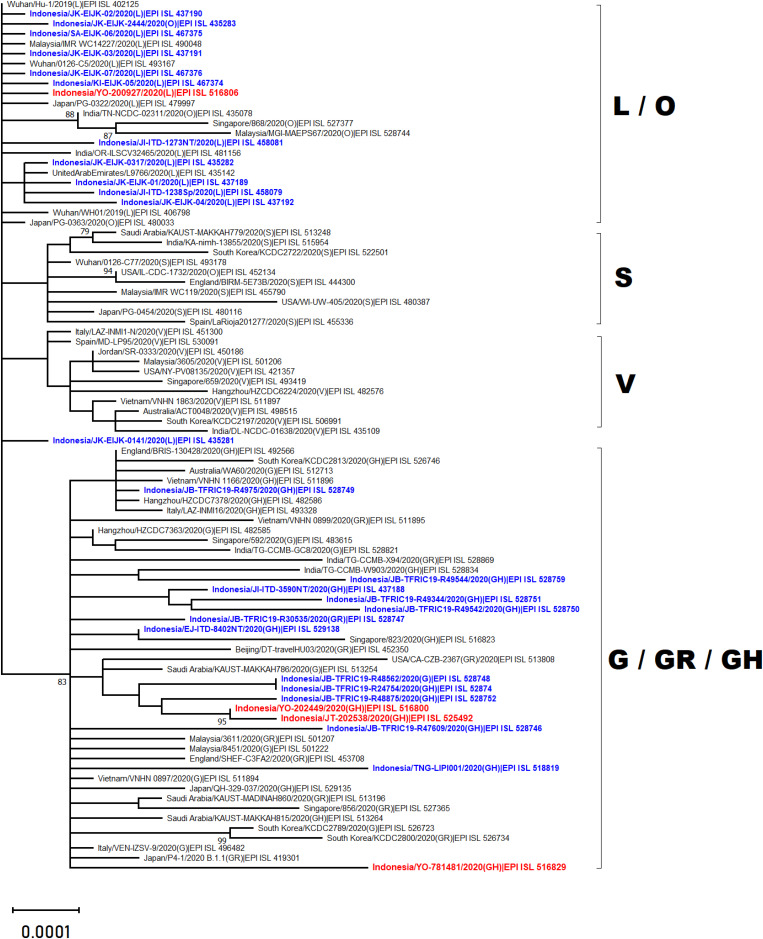
Figure 2. Phylogenetic analysis of SARS-CoV-2 genomes from Indonesia and different countries.
A phylogenetic tree was constructed from 29.400 nt length of the open reading frame (ORF) of SARS-CoV-2 using the maximum likelihood statistical method with 1,000 bootstrap replications and best-fitting DNA substitution model (GTR+G+I) for the dataset. Virus samples from Yogyakarta and Central Java are indicated in red, while those from other regions in Indonesia are indicated in blue. The tree is drawn to scale (0.0001), with branch lengths measured in the number of substitutions per site.

