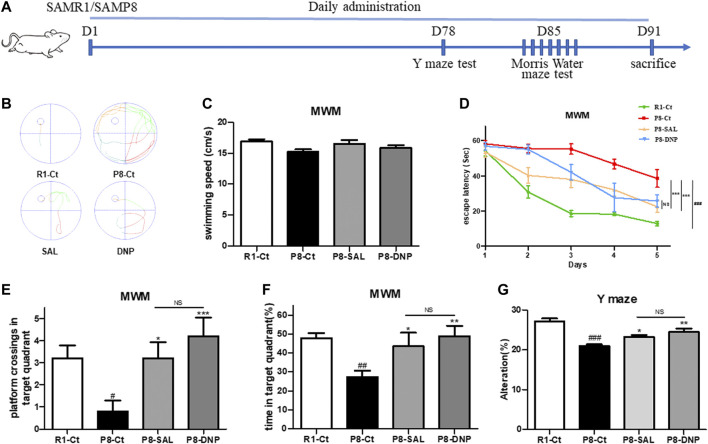
FIGURE 2.
Effect of SAL on the behavioral performance of SAMP8 mice. (A) Schematic of the experimental design. (B) Representative automated traces from day 5 of the MMW are shown for each group. (C) The average swimming speed. (D) The escape latency to reach the hidden platform was measured during the 5-day training period. (E,F) In the probe trial, the number of platform crossings and the percentage of time that the mice spent in the target quadrant were analyzed (n = 5 for each group). (G) The percentage of correct alternations (alternation rate) in the Y maze test was calculated (n = 8 for each group). All data are shown as the mean ± SEM. One way ANOVA for (D–F), two way ANOVA for (C). #p < 0.05, ##p < 0.01, and ###p < 0.001 versus the R1-Ct group and *p < 0.05, **p < 0.01, and ***p < 0.001 versus the P8-Ct group. “ns” indicates no significant difference.

