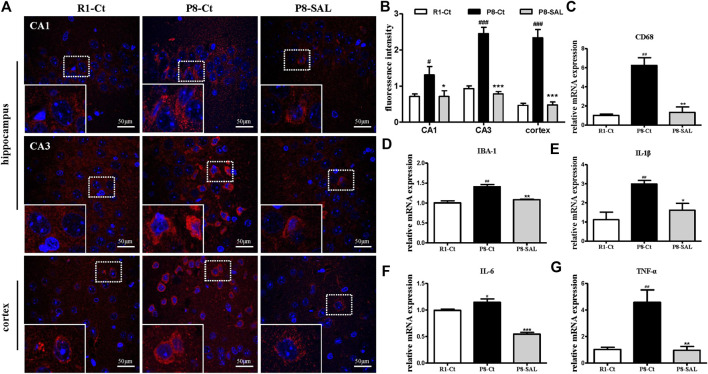
FIGURE 4.
Effect of SAL on neuroinflammation in SAMP8 mice. (A,B) Representative images and quantification of immunofluorescence analysis using antibodies against CD68 (red) and DAPI staining (blue) in the hippocampus (CA1 and CA3 regions) and cortex (magnification ×400). The dotted box presents an enlarged image of the inset. The mRNA levels of (C) CD68, (D) IBA-1, (E) IL-1β, (F) IL-6 and (G) TNF-α,were determined by qPCR. All data are shown as the mean ± SEM (n = 3 for each group). # p < 0.05, and ## p < 0.01 versus the R1-Ct group and *p < 0.05, **p < 0.01, and ***p < 0.001 versus the P8-Ct group.

