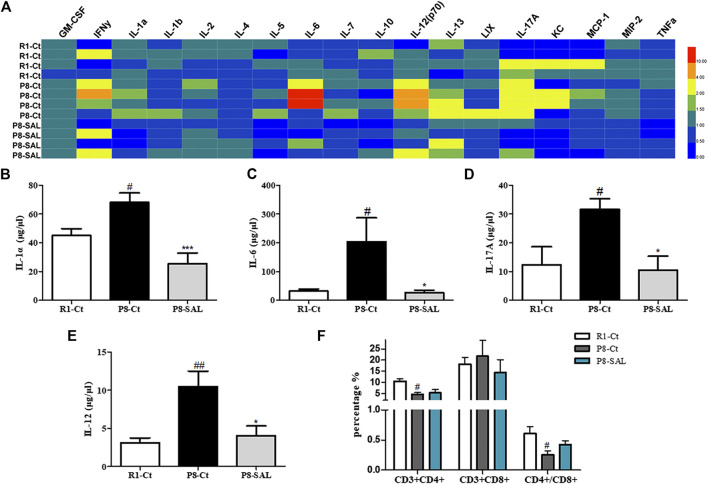
FIGURE 7.
Effect of SAL on peripheral inflammation in SAMP8 mice. (A) Heatmap of 18 serum cytokine/chemokine levels, as detected by the Mouse High Sensitivity T Cell Magnetic Bead Panel. Quantitation of (B) IL-1α, (C) IL-6, (D) IL-12 and (E) IL-17A levels. (F) The spleen index was calculated as spleen weight (G)/mouse weight (G). (G) Flow cytometry results, including the proportions of CD3+CD4+ and CD3+CD8+ cells and the ratio of CD4+/CD8+ spleen lymphocytes. The bars represent the mean ± SE of each group (n = 3). # p < 0.05, and ## p < 0.01 versus the R1-Ct group and *p < 0.05 and ***p < 0.001 versus the P8-Ct group.

