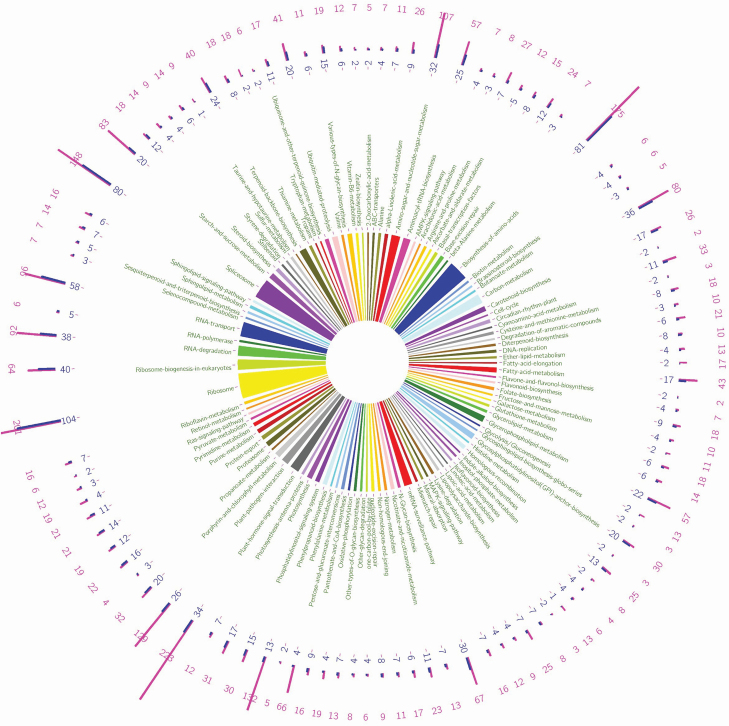
Figure 7.
Statistics layout of the V. faba KEGG pathway-based maps (Functional Maps). Pathways assigned using the designed SSR primers. The middle part of the figure shows the pathways name. The outer part of the figure reveals the histogram, number of enzymes and number of designed primers (EST or EST-SSR) in each pathway (where the blue colour refers to the number of enzymes in the pathway and the purple colour refers to the number of designed primers in each pathway).

