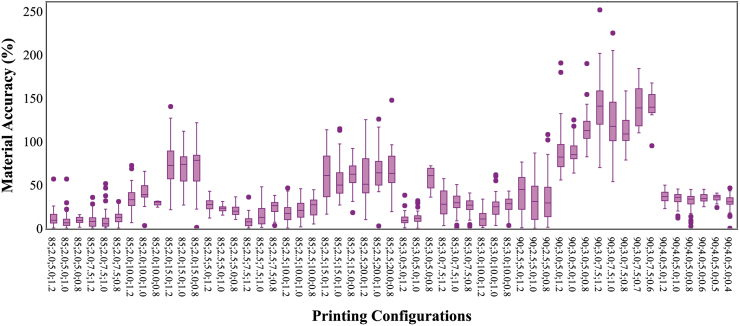
FIG. 3.
Material accuracy is plotted for the whole dataset of printable configurations. Data points that share the same material composition, printing speed, printing pressure, and programmed spacing are combined in a box plot. Material accuracy values are shown on the y-axis. Printing configuration of data points is shown on the x-axis (material composition (wt% PPF); printing pressure (bar); printing speed (mm/s); programmed spacing (mm), respectively).

