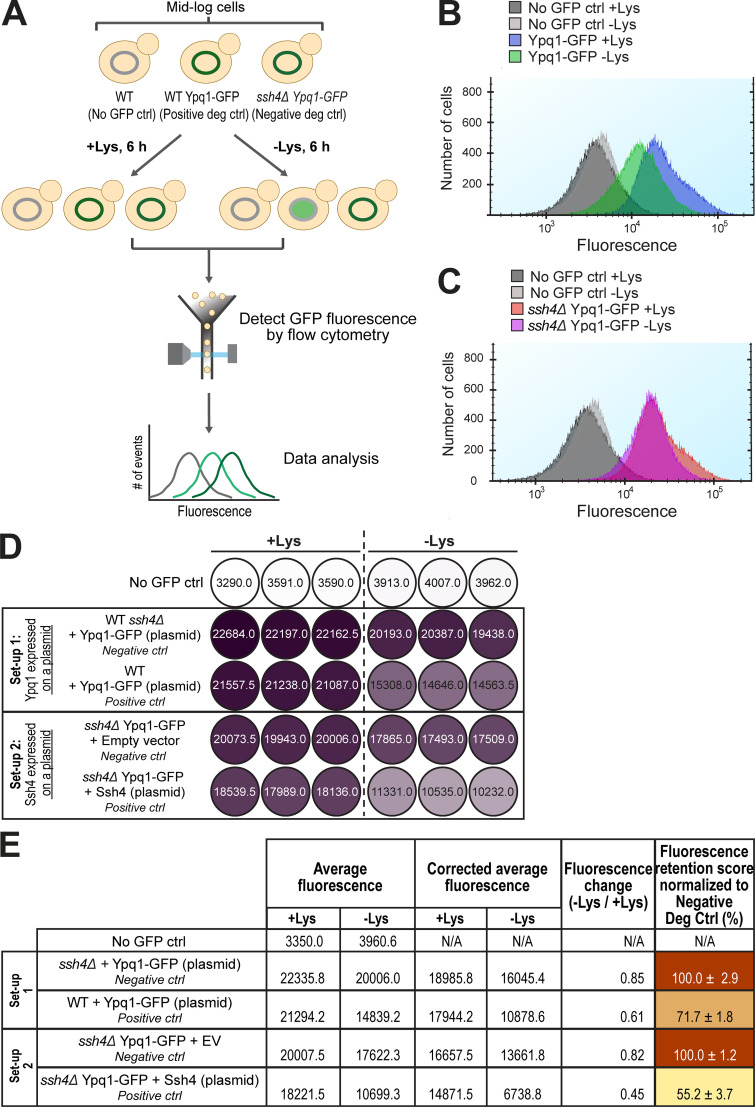
Figure S2.
Suppressor residues and flow cytometry-based method to quantify Ypq1-GFP degradation. Related to Fig. 2. (A) Workflow of flow cytometry–based degradation assay. Shown are several degradation controls (deg ctrl). (B) Fluorescence histogram of cells expressing Ypq1-GFP grown in the presence or absence of Lys. No GFP ctrl: WT SEY6210. (C) Fluorescence histogram of cells expressing Ypq1-GFP but lacking Ssh4 in the presence or absence of Lys. No GFP ctrl: WT SEY6210. (D) Heat map showing fluorescence (arbitrary units) in three replicates of no GFP control, negative control, and positive control in two experimental setups. Setup 1: Ypq1-GFP expressed in a plasmid, Ssh4 from the genomic locus. Setup 2: Ypq1 was chromosomally tagged with GFP and Ssh4 expressed in a plasmid. Darker colors correspond to higher fluorescence. (E) Step-by-step calculation used to generate heat map in Fig. 2 E. First column: Fluorescence values from three replicates were averaged. Second column: Fluorescence values were corrected by subtracting average fluorescence values of no GFP control strain. Third column: FC values were calculated by dividing the CAF at −Lys by the CAF at +Lys. Fourth column: Final FR scores were calculated by dividing the FC value of the sample with the FC value of the negative control. This sets the value of the negative control as 100%. Setup 1 had higher FR scores, possibly because the host strain contained the endogenous Ypq1 that might have “diluted” the degradation. N/A, not applicable.

