Figure S5.
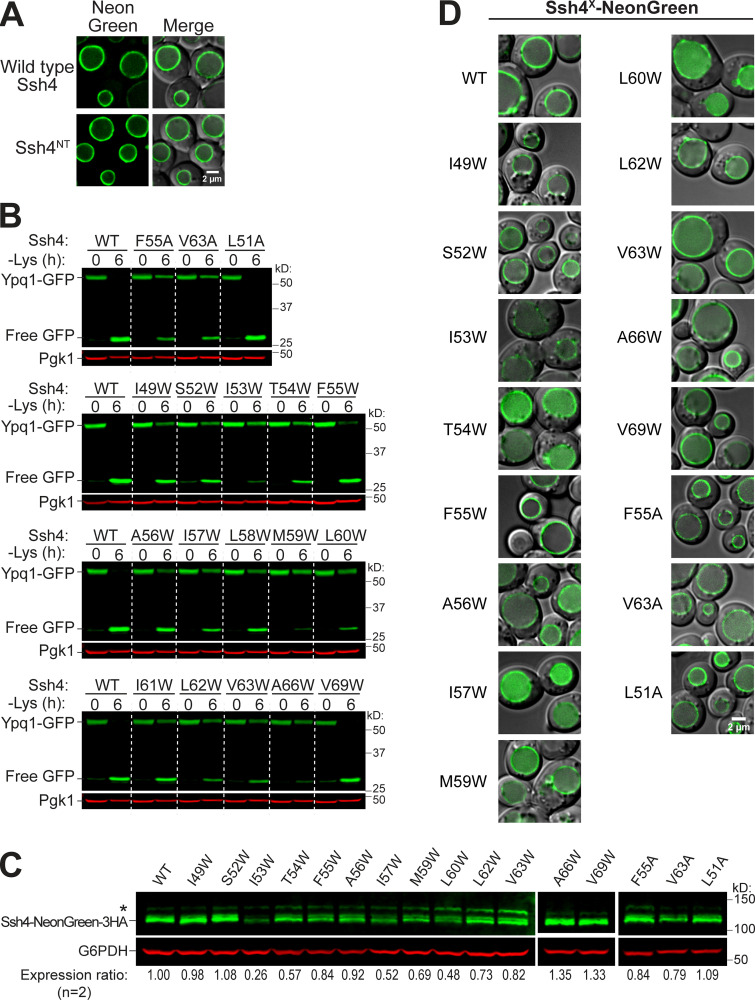
Expression and localization of Ssh4 mutants. Related to Fig. 4. (A) Subcellular localization of NeonGreen-3HA-tagged WT Ssh4 and Ssh4NT. Scale bar, 2 µm. (B) Ypq1-GFP degradation when combined with representative Ssh4 Ala (A) or Trp (W) mutants. Quantification shown in Fig. 4 C. (C) Protein levels of NeonGreen-3HA-tagged Ssh4 mutants. G6PDH, loading control; *, nonspecific band. (D) Subcellular localization of NeonGreen-3HA-tagged Ssh4 mutants. Scale bar, 2 µm.

